Views, layers and tools
The seven views of the plant, the tools beside the view tabs, moving round the plot, the Layers popover and the plant chips.
The right side of the main window shows one plant seven ways. They are tabs across the top of the right side, and each takes the whole area under the header.
| Tab | Keys | What it shows |
|---|---|---|
| Layout | Ctrl+1 | The drawing |
| Summary | Ctrl+2 | The figures as a sheet, by plant or by ICR block |
| Checks | Ctrl+3 | The design checks and their results |
| Workings | Ctrl+4 | How each number was reached |
| Energy | Ctrl+5 | The yield result |
| BOM | Ctrl+6 | The bill of materials |
| SLD | Ctrl+7 | The single-line diagram |

The Energy tab reads "Energy •" when a result landed while another view was up. Leaving Layout for any other view stops a building placement and leaves Sketch Mode.
The tools row
The tools sit to the right of the tabs and change with the view.
| Tool | View | What it does |
|---|---|---|
| Save project | every view | Writes the session to a project file — Saving and reopening projects |
| Export ▾ | every view | The export menu: Export deliverables…, BOM · Excel workbook…, BOM · PDF…, Earthing layout (DXF)… and Export Image (PNG) — Exports |
| Satellite | Layout | An aerial photograph behind the layout, aligned to the site's position. Needs an internet connection; disabled until a layout exists. Refused on a site loaded as layout only, which has no position — "Satellite imagery needs the site's location." |
| Wireframe | Layout | Draws tables or tracker units as outlines only |
| Piles: OFF / Piles: ON | Layout | The pile overlay. The first use opens the pile editor; disabled until a layout exists — Piles |
| Layers ▾ | Layout | The popover of drawing layers, below |
| Sketch | Layout | Switches Sketch Mode on — Sketch Mode |
| Home, Pan, Zoom | Layout | The three navigation tools. Home fits the whole plant |
| ⛶ | Layout | Opens the plot in the Expanded View window, below |
| Open in window | Summary, Energy | Opens the sheet and the monthly energy in a separate window, for example on a second monitor |
| Copy | Energy | Puts the monthly energy table on the clipboard, to paste into Excel |
Checks, Workings and BOM add nothing to Save project and Export ▾. The SLD view's own controls sit on its canvas — see Single-line diagram.
Moving round the plot
| Gesture | What it does |
|---|---|
| Mouse wheel | Zooms at the cursor |
| Trackpad pinch | Zooms at the pointer |
| Middle button drag | Pans, always: on the Layout view, in Sketch Mode, while placing a building or drawing an obstruction |
| Space + left drag | Pans; the cursor is a hand while Space is held |
| Plain left drag | Pans when nothing else claims the press: no Sketch Mode, no obstruction being drawn, no click awaited to place a building or an AC start point |
| F | Fits the whole plant. Needs the plot to have the keyboard, which a pan press gives it |
While the toolbar's Pan or Zoom is on, these gestures do nothing.
The Layout view is read-only: with Sketch off, a drag on an ICR, the main control room (MCR), a substation (USS), a handover point or an object pans the view. In Sketch Mode the same drag moves the building.
Whatever framing you set stays through redraws — a layer toggle, a moved control room, a drawn obstruction — until you click Home, generate a layout, or load a boundary file. These gestures belong to the plot; the SLD view has its own.
When the window is narrow
Every tool stays reachable at every width. When Satellite, Wireframe and Piles do not fit beside the tabs, they move to the top of the Layers popover as ON/OFF rows — Satellite image, Wireframe tables, Piles — and the button reads Layers ▾ +3.

The Expanded View window
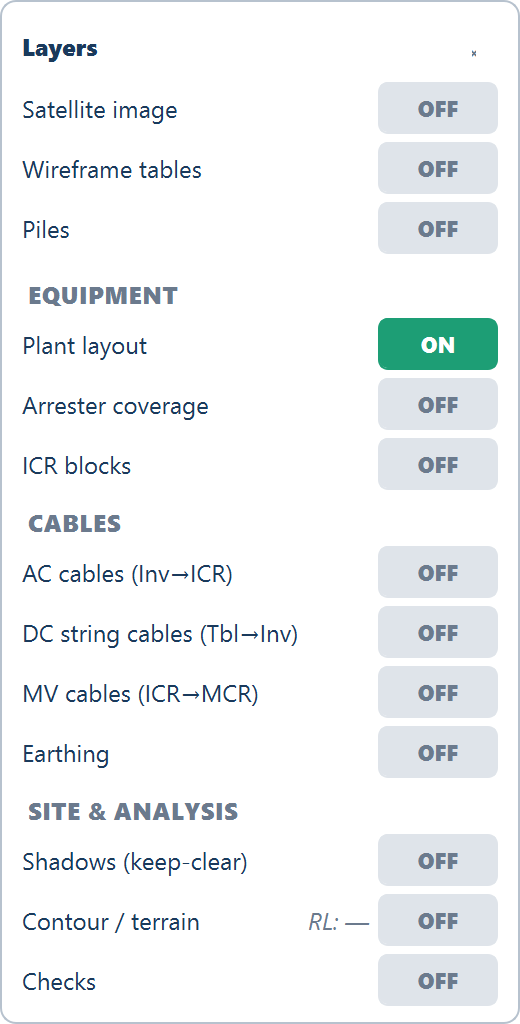
⛶ opens SolarLayout — Expanded View: the plot alone in a large, resizable window with a full toolbar and a ⟵ Return to Main Window button. While it is open the main window's plot area reads "Plot is open in the Expanded View window. Close that window to return the plot here."
The Layers popover
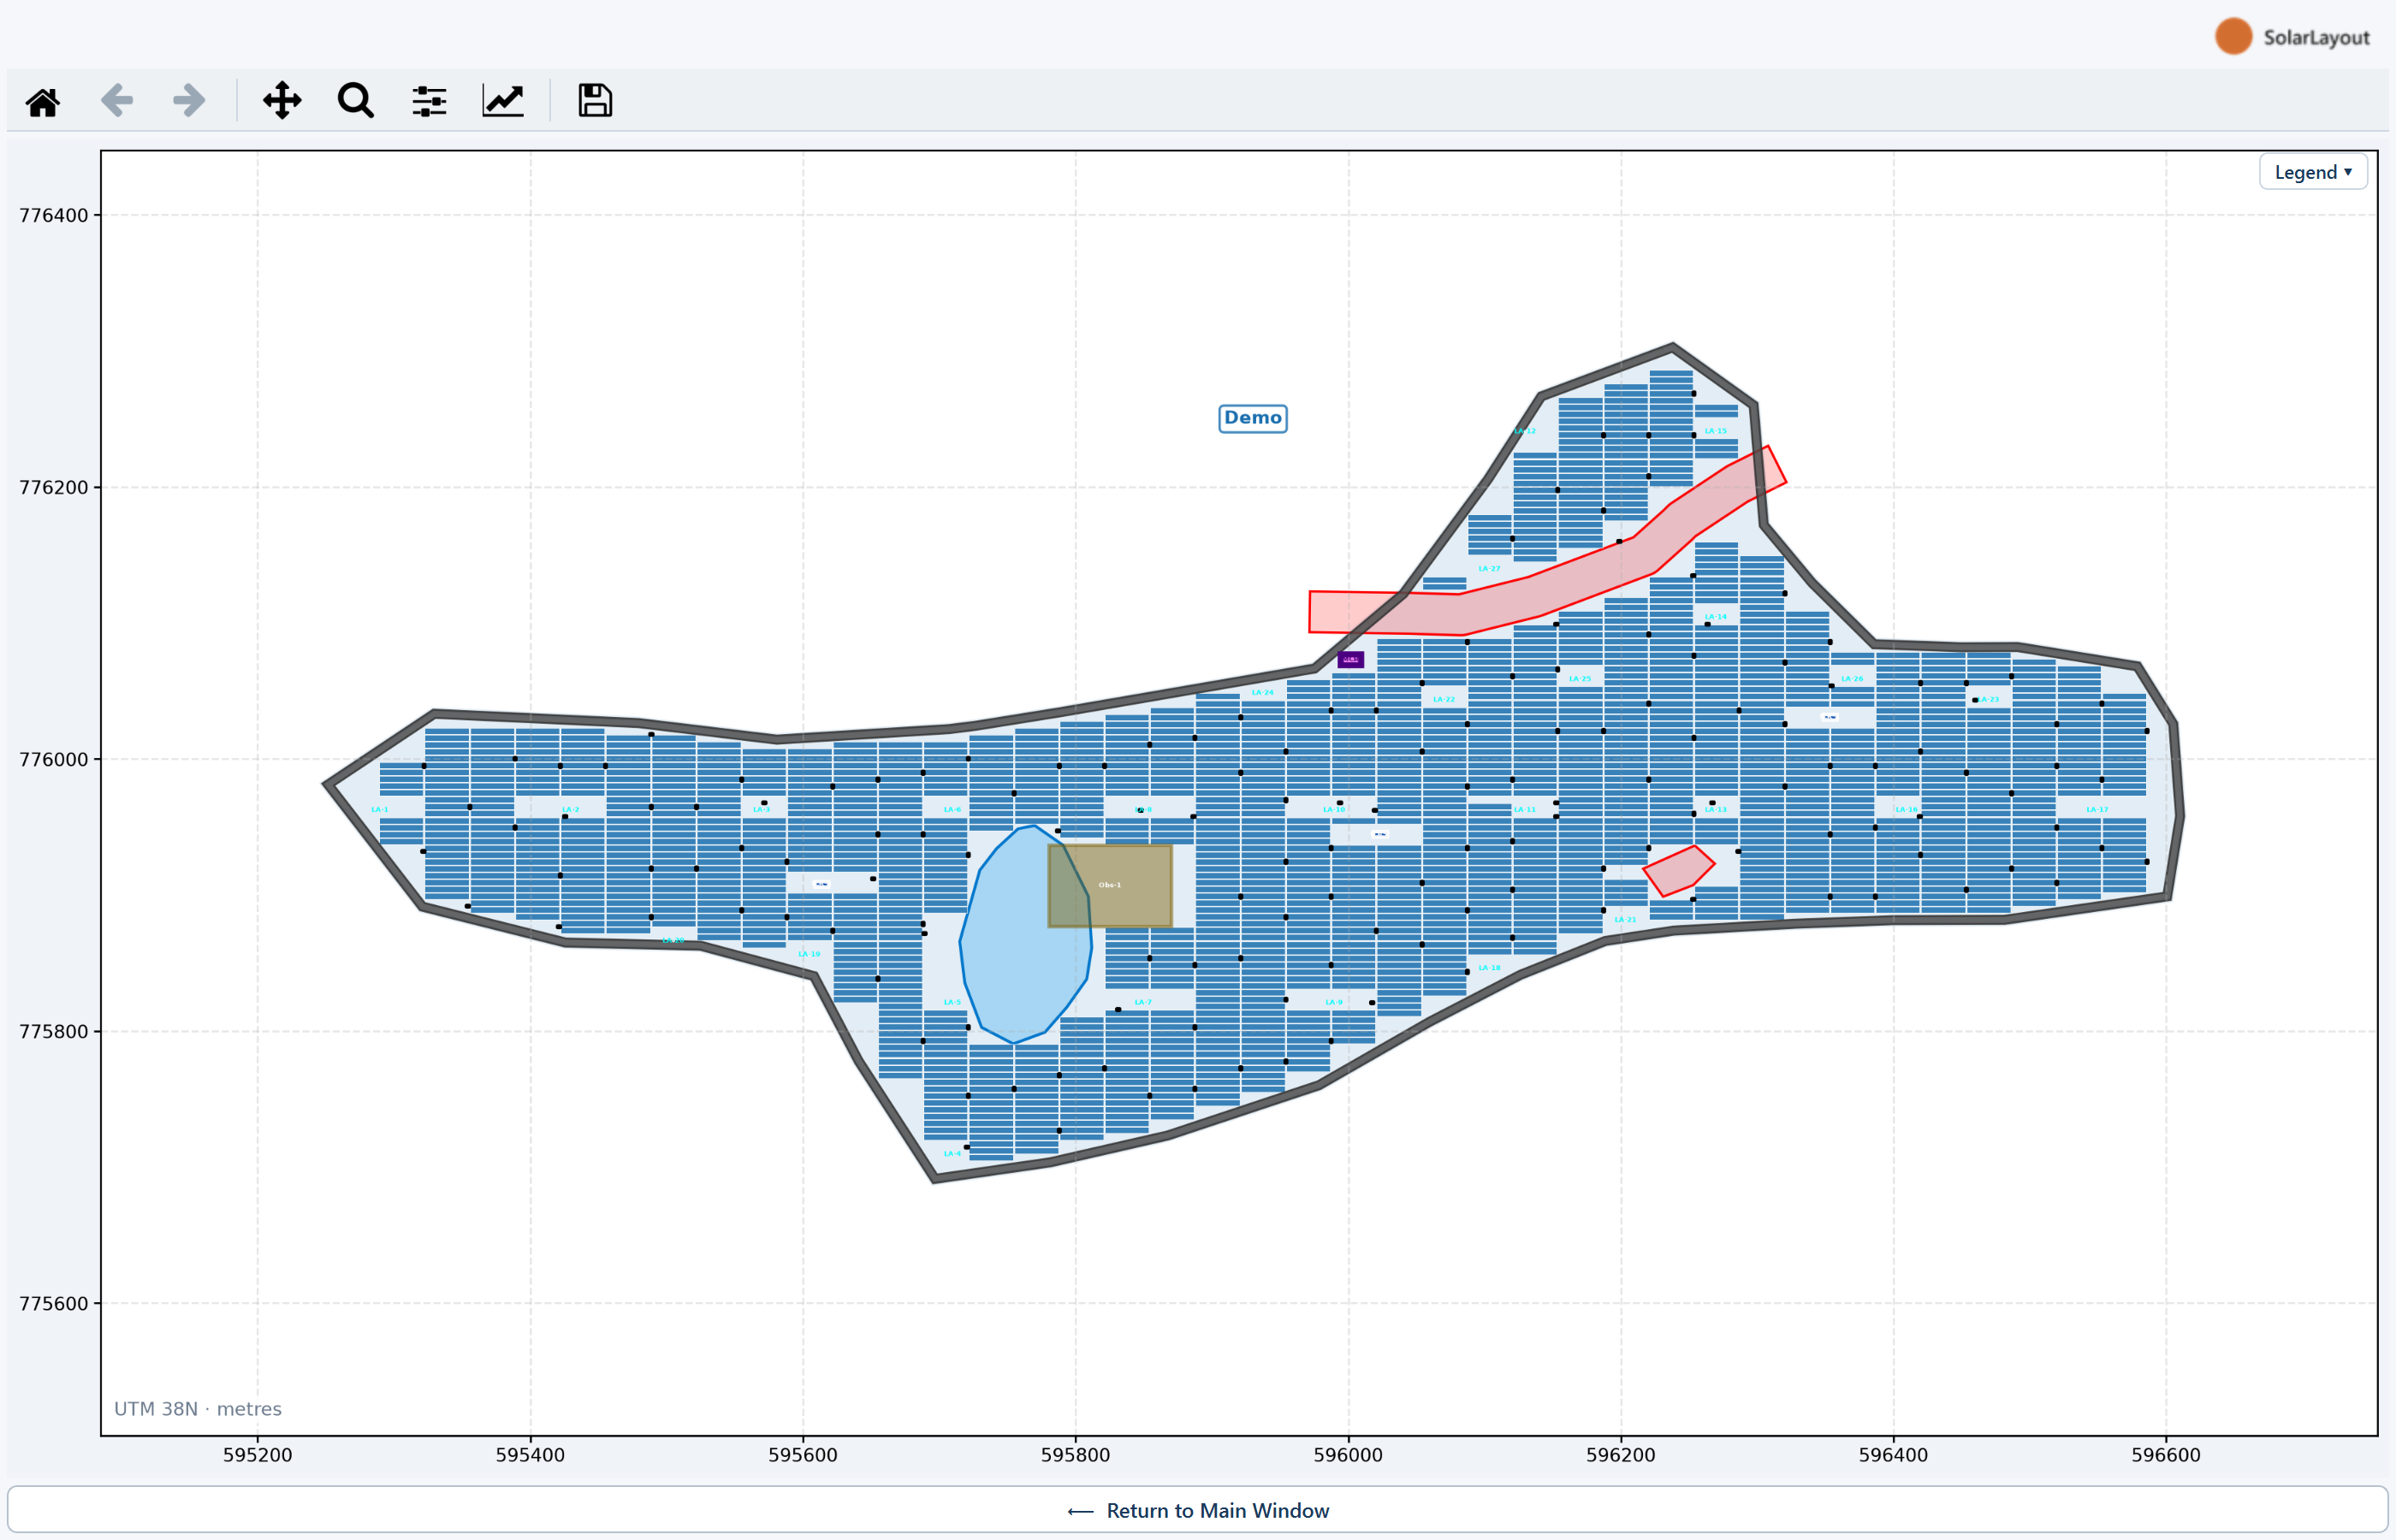
Layers ▾ opens a small popover of ON/OFF pills: ten rows in three groups.
| Group | Row | Default | What it shows |
|---|---|---|---|
| Equipment | Plant layout | ON | The plant: tables, buildings, inverters, arresters, street lights and roads. OFF leaves only the boundary and obstacles |
| Arrester coverage | OFF | Each lightning arrester's protection circle. The masts and their LA-n labels belong to Plant layout | |
| ICR blocks | OFF | Each block filled in its own colour and outlined. Enabled once inverters are placed. It only colours — ICR blocks | |
| Cables | AC cables (Inv→ICR) — reads DC cables (SMB→CI) on a central-inverter design | OFF | Enabled only when cables were calculated |
| DC string cables (Tbl→Inv) | OFF | Enabled only when cables were calculated | |
| MV cables (ICR→MCR) | OFF | Needs an MCR or a handover point placed, and cables calculated | |
| Earthing | OFF | The project's earthing design on the plan: its strips, jumpers and pits. The first show works it out under the card "Working out the earthing…". Hidden with Plant layout off | |
| Site & analysis | Shadows (keep-clear) | OFF | A grey hatched patch over the ground kept clear for the shadows of buildings, arresters and street lights. Showing it changes nothing in the layout. Hidden with Plant layout off |
| Contour / terrain | OFF | The elevation contours, with an RL: readout of the range and the excluded ground. Needs terrain data | |
| Checks | OFF | A badge on each object an open design check touches — Design checks |
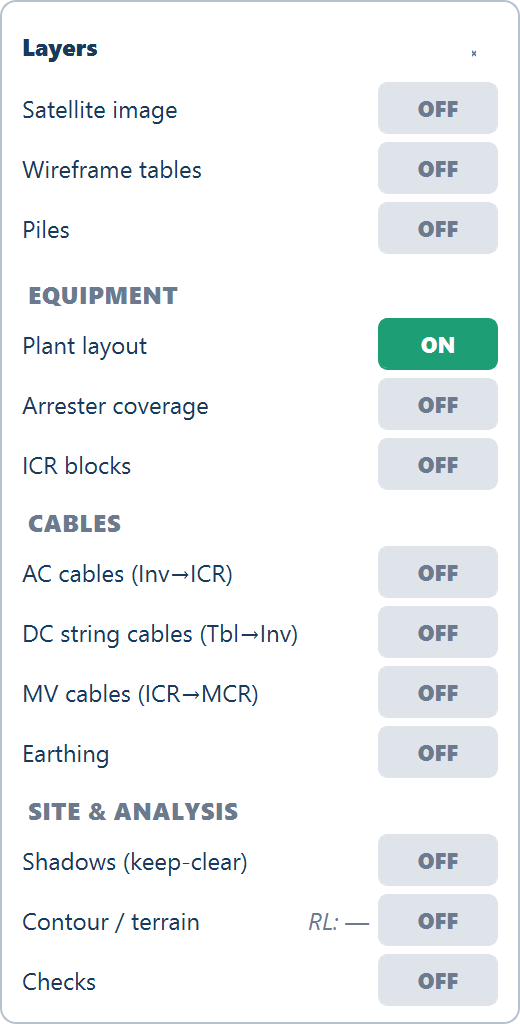
A first layout is therefore drawn as the placement alone: cables, coverage and contours have been computed where you asked for them, but stay off until you switch them on. The plot carries a units note in its bottom-left corner: "UTM 38N · metres" (with the site's own zone) for a Google Earth file or a CAD drawing located by its own coordinates, and "Drawing coordinates · metres" for a CAD drawing or an image placed by hand or loaded as layout only — see CAD drawing boundaries.
While the layout is out of date the plot dims, and an amber note at its top-left names what changed, with a Show 1 change or Show 2 changes link that opens the list of changes.
The Legend chip
The legend is folded away by default so it never sits on the drawing. A small Legend ▾ chip in the plot's top-right corner (Layout view only) unfolds it; the chip then reads Legend ▴, and the open legend can be dragged and keeps its place across a rebuild. It lists only what shows, so LA Protection Zone, for example, is absent while Arrester coverage is off.
The plant chips
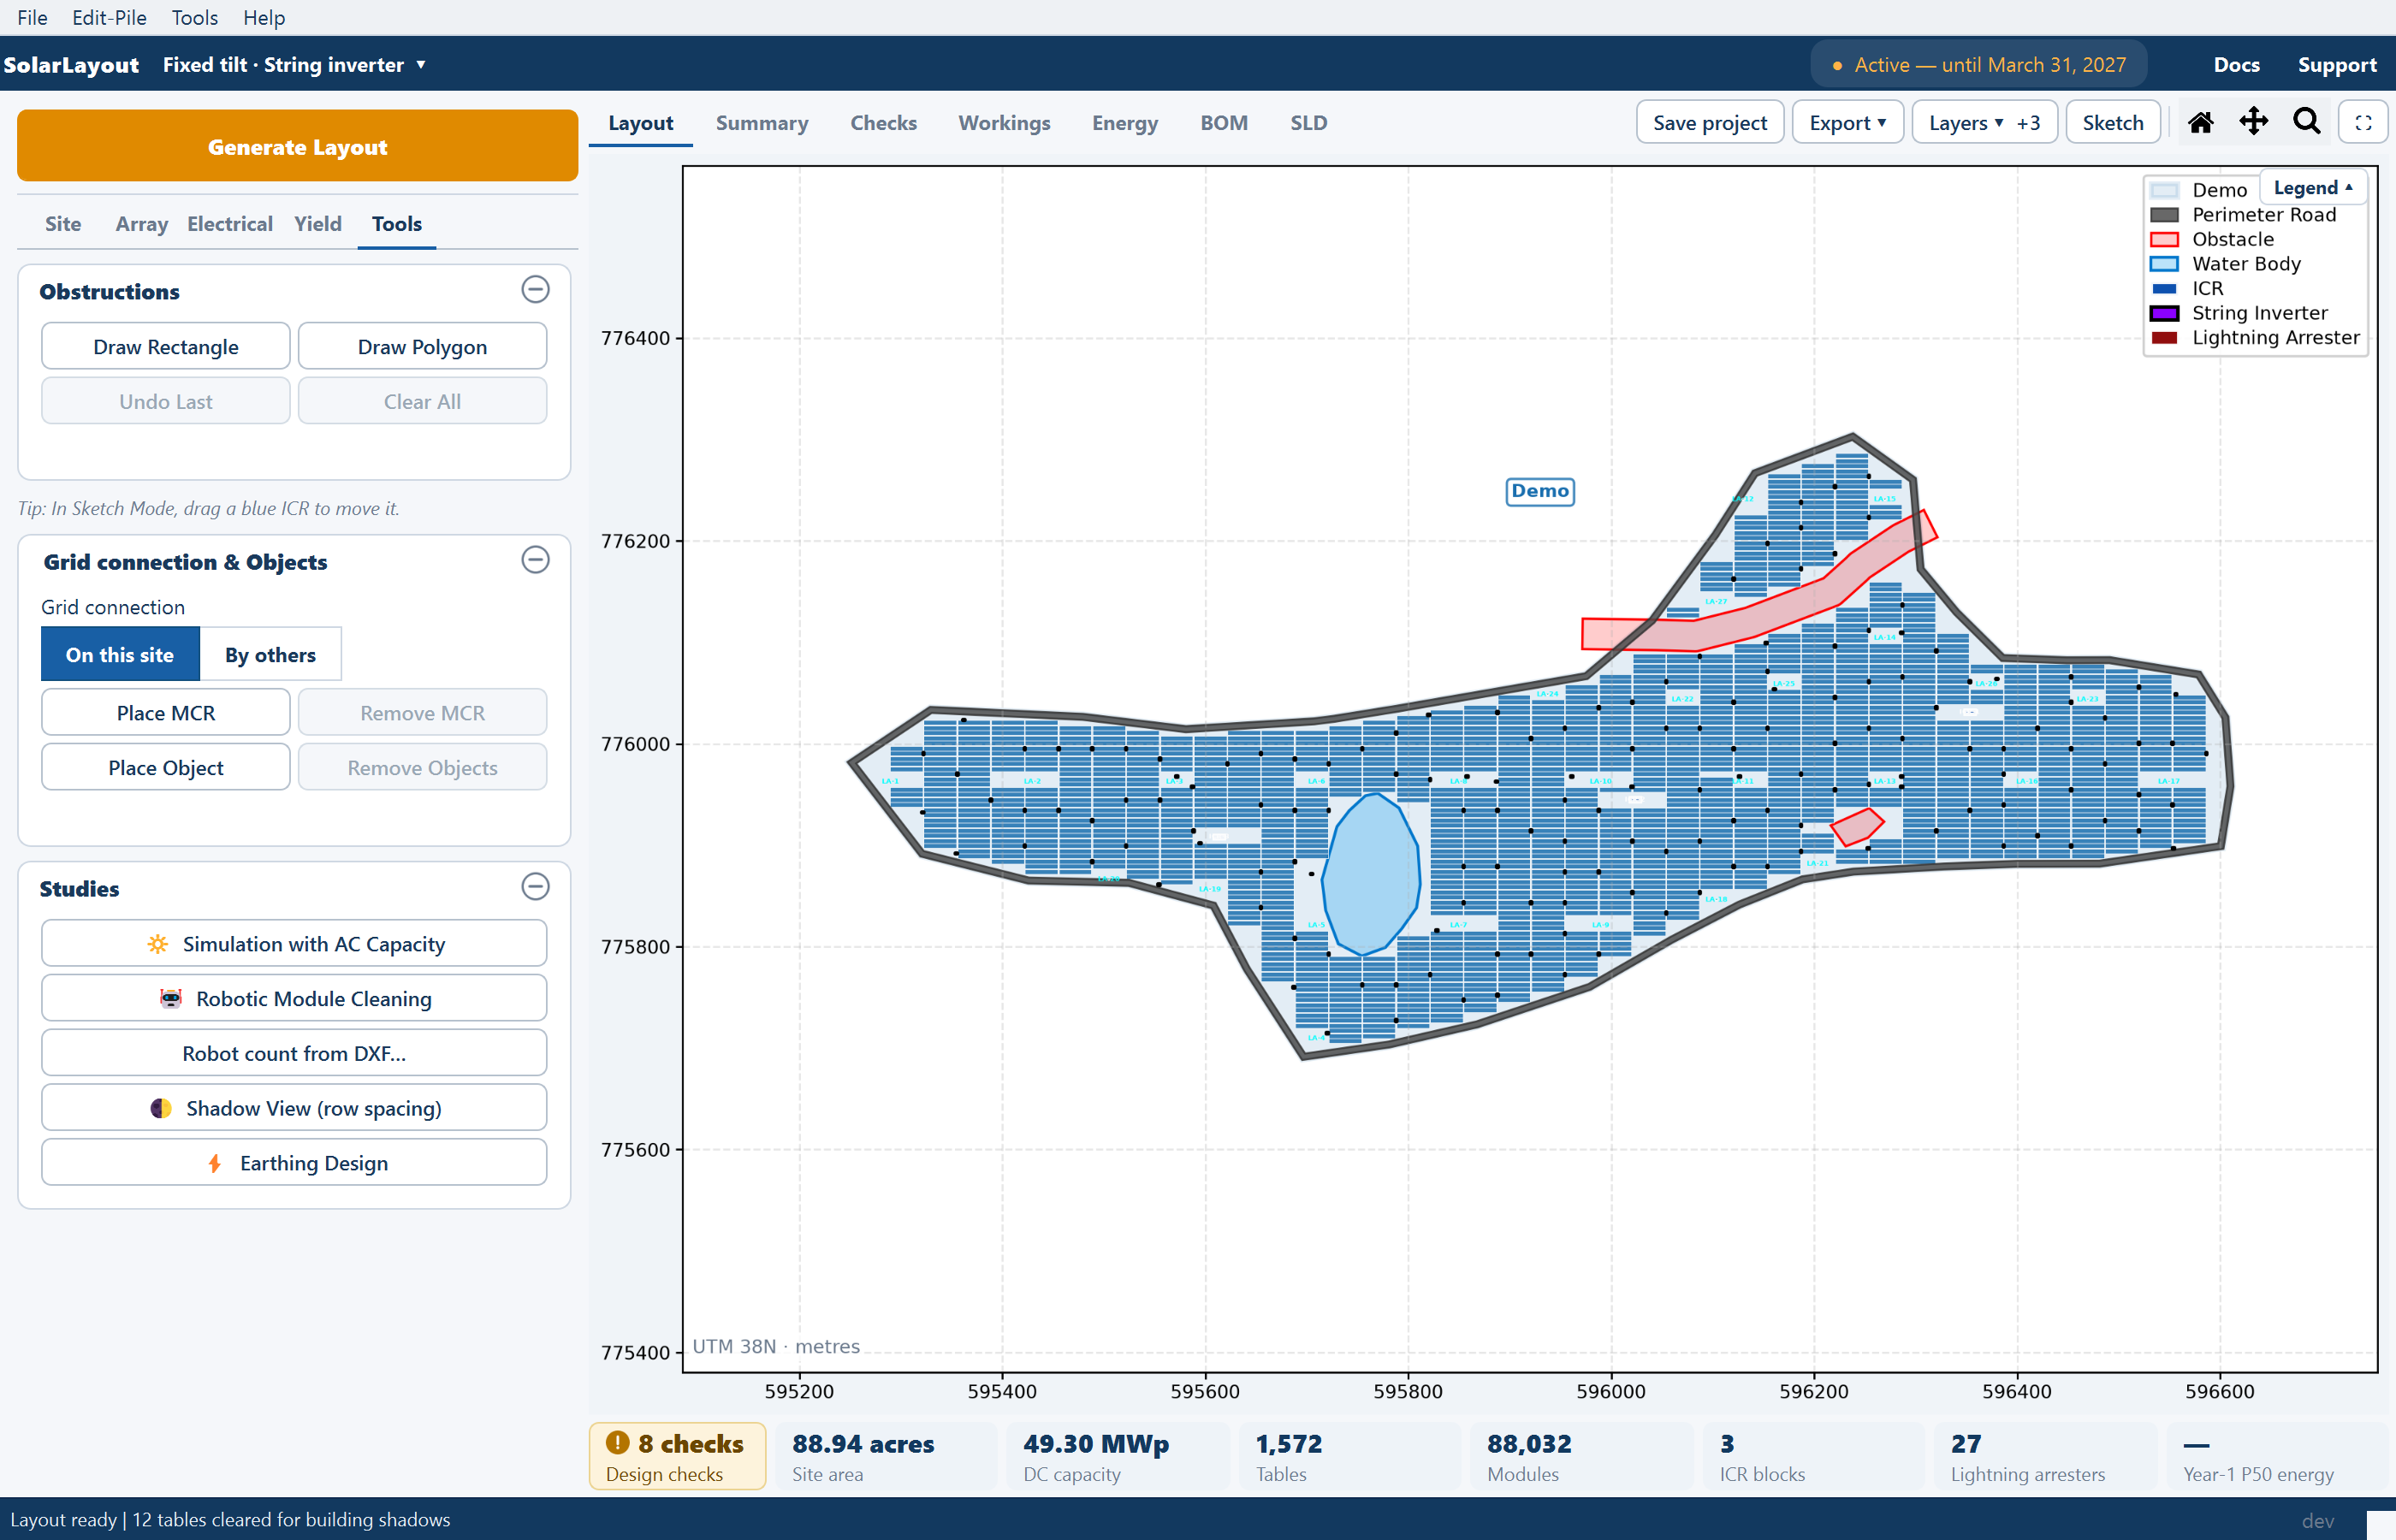
One row of chips runs under every view and never wraps. It is the only place the plant totals are shown — the status bar does not carry them.

| Chip | Value | A click opens |
|---|---|---|
| Out of date | Amber, value Out of date, caption figures from the last run, while any input differs from the last run. Every other chip is greyed meanwhile, except Design checks | Summary |
| Design checks | 1 check or N checks, in the warning colour: the checks that are open or to re-confirm, can't-check rows included | Checks |
| Site area | The gross boundary area, in acres | Summary |
| DC capacity | Installed DC, in MWp | Summary |
| Plants | The number of plots — shown only for a multi-plot file | Summary |
| Tables or Trackers | Units placed | Summary |
| Modules | Modules across the plant | Summary |
| ICR blocks | Inverter control rooms placed | Summary |
| Lightning arresters | Shown only once some are placed | Summary |
| Year-1 P50 energy | Year-one generation in MWh at the first exceedance probability, or — before an energy run | Energy |

When the row is too narrow, a chip that does not fit is hidden, never clipped: Lightning arresters first, then Plants, ICR blocks, Tables and Modules; Site area, DC capacity and energy go last, and the two state chips never. Before Generate Layout, a boundary preview fills Site area and Plants, and the others read —.
Design checks reads Checking… before the first report and Checks didn't run if a run failed.
The energy chip's caption stays Year-1 P50 energy when you change the first exceedance probability; its value follows that probability. Check the setting on the Yield tab before quoting the figure.

The Summary view
The Summary view is the plant's figures as a sheet, with a Plant | By block switch above it. By block gives one column per ICR block, then Shared and Total; Plant gives one column per plant. A reason in a cell stands where a figure can't be given yet, and links to the input it needs; How? on a row opens that figure's working.
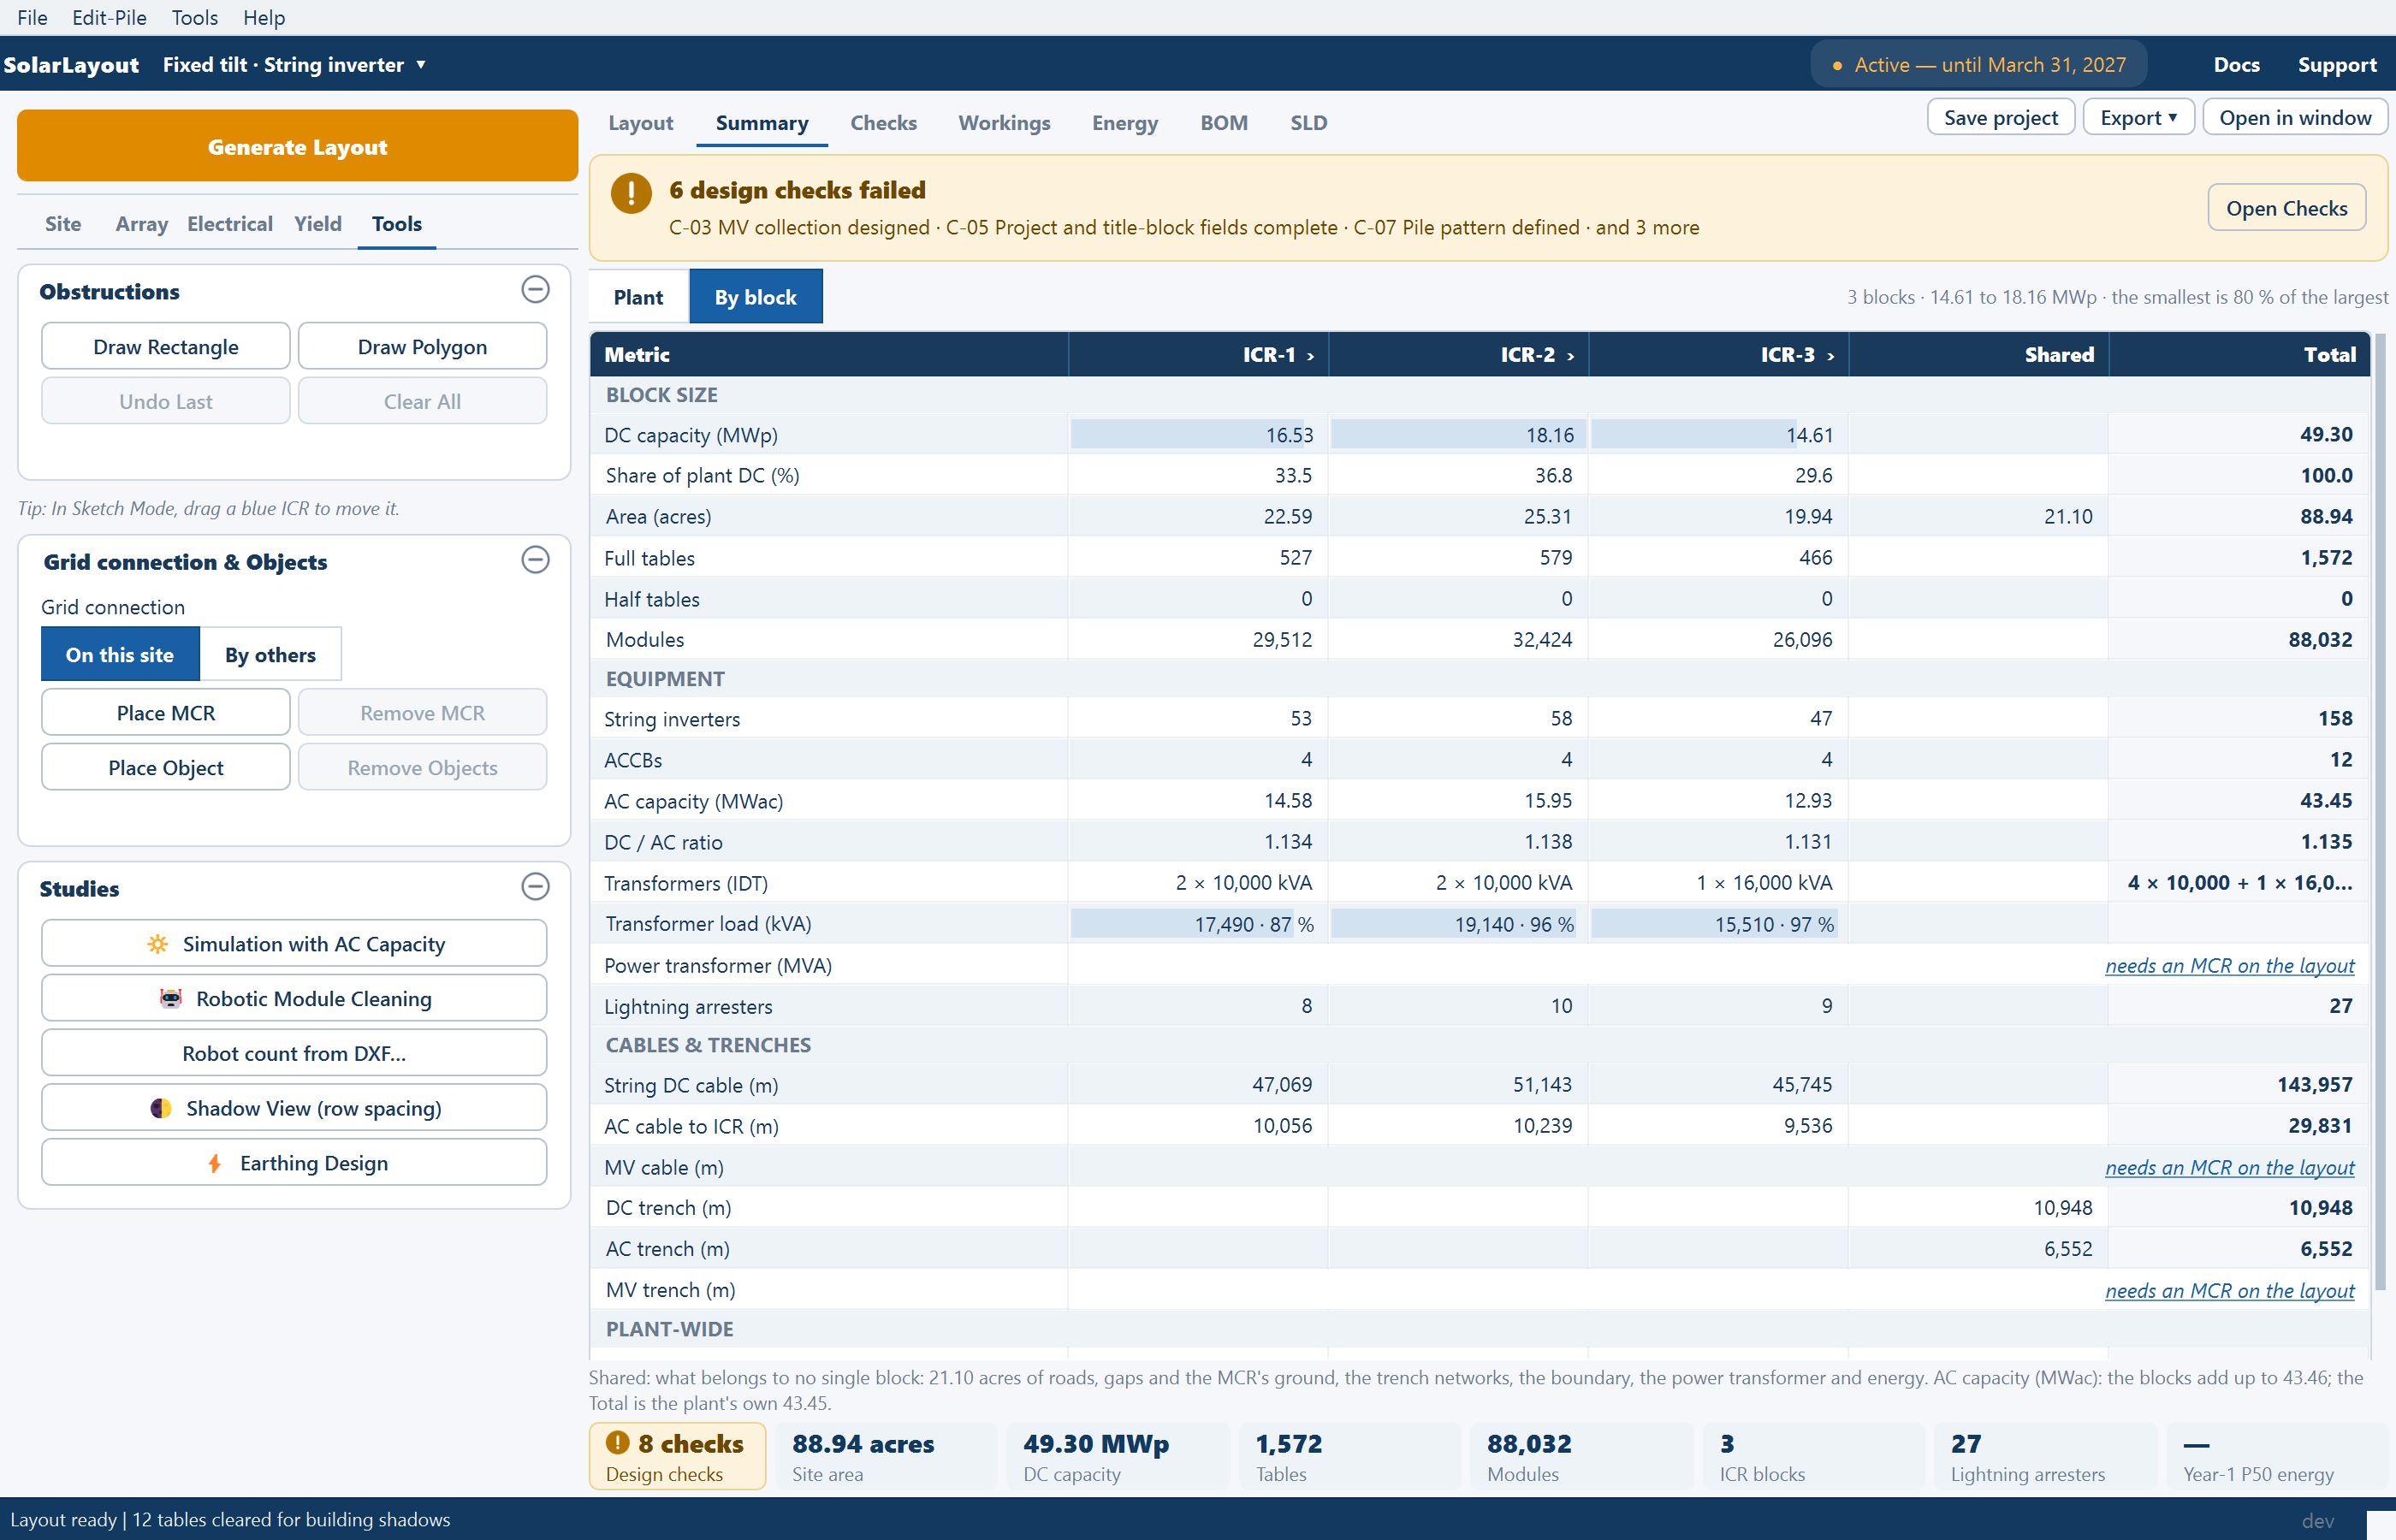
Above the sheet, when they apply: the out-of-date banner, a line on the failed design checks with Open Checks, and a note listing the settings changed in Advanced settings with Edit….
Open in window opens a separate window with a Summary tab and a Monthly energy (Year 1) tab — the second enabled once energy exists — that follows the layout as you work. Every row, reason and note is on Summary view.
The Checks view
The Checks view lists the design checks with their results, a Fix link for what can be fixed, and Accept… for a finding the design stands by. The checks run by themselves whenever the summary refreshes. See Design checks.
The Workings view
The Workings view shows how each number was reached: the rule, the arithmetic, the inputs it used and which rule decided it. See Workings.
The Energy view
Before a run the view reads No energy result yet, explains what the run will use, and offers a gold Calculate energy button — the same action as Calculate Energy on the Yield tab. On a site loaded as layout only the note reads "Energy yield is off: the site's location is unknown (layout only)." After a run it shows five tiles — Year-1 energy, Specific yield, Performance ratio, CUF on DC, CUF on AC — the monthly table to IEC 61724-1, an irradiation and performance-ratio chart, and the monthly energy bars. CUF is the capacity utilisation factor.
The result belongs to the layout it was calculated for. While that layout is out of date a banner sits above the tiles and the figures are greyed; a further Generate Layout clears the result, and the view then reads Layout regenerated until you calculate again. See How yield is calculated.
The BOM and SLD views
BOM shows the bill of materials on the right and hands the left column to the builder under a green Bill of Materials banner; select a line to see how it is counted. SLD opens on the automatic diagram for review, with its panel on the left under a blue SLD Preparation banner. Each banner carries the Exit button that gives the column back. See Bill of materials and Single-line diagram.
Where to go next
The main window
The menu bar, the ribbon, the pinned Generate Layout button, the five stage tabs of inputs on the left, the seven views on the right, and the status bar.
Design checks
The Checks view — when the checks run, how to read a row, Fix and Show on layout, accepting a finding, the badges on the plot, and where results go.