Building the single-line diagram
Diagram mode — the A3 drawing sheet, the drawing tools, and how the finished diagram reaches the report, a standalone PDF and a CAD file.
⚡ SLD on the plot toolbar opens diagram mode, where you draw the plant's single-line diagram — SLD, the one-line electrical schematic that shows how the modules reach the grid. You draw it on a proper drawing sheet, with a border, a zone grid, a legend band and a title block, and the finished sheet is written into the exported PDF report as its own page. It can also leave on its own, as a PDF or as a CAD drawing.
The diagram is a drawing, not an electrical study. Auto-build lays down a starter chain from the plant's own equipment counts, and the symbol palette carries the switchgear and instrumentation an SLD normally shows — but the ratings you print, the protection you draw and everything a grid connection needs are yours to put on the sheet.
Entering diagram mode
The ⚡ SLD button is off by default. Switch it on and the symbol palette and the drawing tools appear, with the drawing sheet in place of the plot.
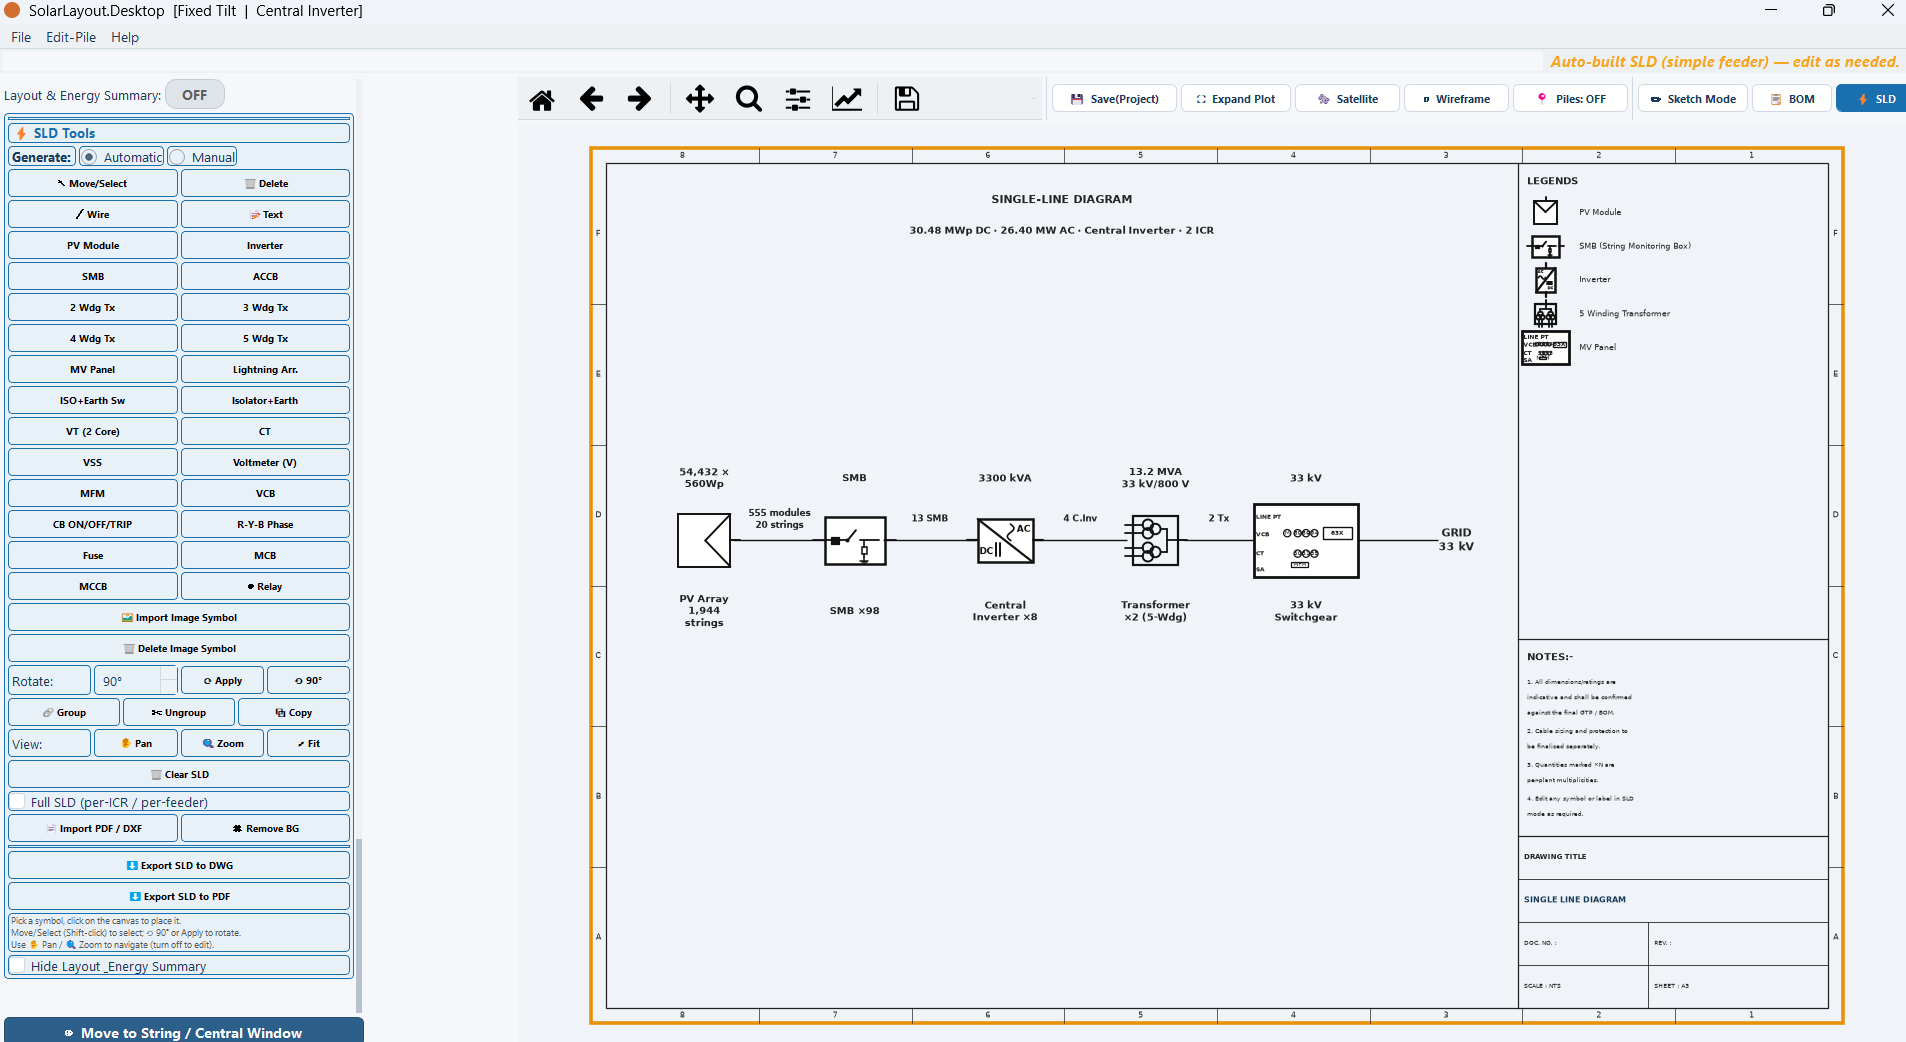
Two things are worth doing before you start drawing:
- Generate the layout first if you intend to use auto-build. Auto-build reads the plant that is currently placed, so it has nothing to work from until a layout exists. The drawing tools themselves work on whatever is on the sheet. See Building a diagram from the plant.
- Click Hide Layout & Energy Summary. The summary table under the drawing is of no use while you are drawing, and hiding it enlarges the working area.
The drawing sheet
The sheet is an A3 landscape frame — 420 × 297 drawing units, the proportions of an A3 page in millimetres. Everything you place sits inside it, and the frame itself is drawn for you.
| Part of the sheet | What it is |
|---|---|
| Outer border | An orange rule around the whole sheet |
| Inner frame | The frame the drawing area sits inside |
| Zone grid | Numbers 8 down to 1 across the sheet and letters F down to A down its side, so a note or a revision can name the zone it refers to |
| LEGENDS | A panel in the right-hand band, for the symbol key |
| NOTES | A second panel in the right-hand band, for drawing notes |
| Title block | The block at the foot of the right-hand band, carrying the drawing's identity |
The title block ships blank
The title block is a skeleton. It carries generic field labels only — no company name, no project name, no drawing number, no drawn-by or checked-by names, no revision. Nothing is filled in for you, and nothing is filled in from the plant.
That is deliberate: the sheet leaves your machine as your drawing, under your own title block. Fill the fields in with the Text tool, in the same way you would label anything else on the sheet, before you export.
The same applies to the two panels above it. LEGENDS and NOTES are empty frames waiting for the symbol key and the notes your own drawing standard requires.
Paper size on a large plant
A plant with many control rooms produces a long chain, and a long chain needs more paper. The physical paper size therefore grows — A3, then A1, then A0 — while the drawing coordinate box stays at A3 proportions.
The consequence is the useful part: the diagram is not re-scaled or re-flowed to fit A3. The geometry you drew is the geometry that prints, on a larger sheet. What you position at one end of the sheet stays at that end.
The drawing tools
Four tools do the drawing.
| Tool | What it does |
|---|---|
| ↖ Move | Click an element to select it, then drag it to a new position |
| Wire | Click-drag to draw a connection between two points |
| Text | Click to drop a label; a label can run to several lines |
| Delete | Click an element to remove it |
Symbols are not on this list because they come from the palette rather than a tool: click the symbol you want, then click the sheet where it goes. The full set, grouped by what it does, is on Symbol reference.
Drawing a wire
Wire draws the connection between two points as a click-drag: press where the run starts, release where it ends. A wire is an element in its own right, so ↖ Move repositions it and Delete removes it without disturbing the symbols at either end.
Draw the bus first and hang the symbols off it. A single-line diagram is read along its bus, and a bus drawn afterwards through symbols already placed tends to end up as a row of short segments rather than one run.
Labelling with text
Text drops a label wherever you click, and a label can run to several lines — which is what makes it usable for a rating stacked under a device name, or for a title-block field with a value under its caption.
Anything you write on the sheet yourself goes on with this tool: the legend entries, the notes, the title-block fields, and any annotation you want beside a symbol. Each one is an element you place, and ↖ Move repositions it afterwards.
Rotating a symbol
Two controls, both acting on the current selection:
| Control | What it does |
|---|---|
| ⟲ 90° | Rotates by ninety degrees |
| ⟳ Apply | Rotates by an angle you type |
Ninety degrees covers most of the work on an SLD, where symbols sit either along the bus or across it. The typed angle is there for the cases that do not — an incoming line drawn at a slant, or a symbol imported from elsewhere that arrives at the wrong attitude.
The inverter and the transformers arrive already rotated
The inverter and every transformer are placed pre-rotated to 270°, so that they line up with the horizontal bus the rest of the diagram is built along. This holds in both electrical topologies — the string-inverter chain and the central-inverter chain alike.
So when you place an inverter or a transformer and it appears turned relative to its palette icon, nothing has gone wrong. It has been oriented for the bus. The symbols that are not pre-rotated are placed as drawn in the palette, and it is those you will occasionally need ⟲ 90° for.
Grouping and copying
| Control | What it does |
|---|---|
| 🔗 Group | Binds the selection into one element, so it moves as a unit |
| ✂ Ungroup | Releases a group back into its parts |
| ⧉ Copy | Duplicates the selection |
The case for grouping is repetition. A feeder bay — breaker, current transformer, voltage transformer, meter, isolator — is the same handful of symbols and wires every time. Draw it once, group it, then copy the group along the bus. Correct one bay afterwards and you can ungroup, edit, and group again.
Getting around the sheet
| Control | What it does |
|---|---|
| ✋ Pan | Drag the sheet under the view |
| 🔍 Zoom | Zoom into a part of the sheet |
| ⤢ Fit | Fit the whole sheet back into the view |
⤢ Fit is the one to reach for after a zoom, and the one to use before an export, so that you are looking at the same sheet the export will write.
Starting over
🗑 Clear SLD empties the sheet — every symbol, wire and label you have placed. The sheet frame, its zone grid and its blank title block remain, because they are the sheet rather than the drawing.
The diagram is part of the session, not a separate file. Saving the project saves the diagram with it, along with the inputs, the layout and the hand edits, and opening that project brings the diagram back as you left it. See Projects.
Building a diagram
Switch diagram mode on
Click ⚡ SLD on the plot toolbar, then Hide Layout & Energy Summary to enlarge the working area.
Lay down the chain
Use auto-build to place the plant's own chain — modules through inverters, breakers, transformer and medium-voltage panel to the grid — annotated with quantities and ratings. Or place the symbols yourself from the palette if the plant is not the subject of the drawing.
Add what the chain does not carry
Place the protection, switching and instrumentation symbols your drawing standard calls for, and wire them in with Wire.
Check every rating
Auto-build annotates what it places from the bill of materials. Read each annotation against the equipment you are actually buying and correct it with Text where it differs.
Fill in the legend, the notes and the title block
All three ship blank. Complete them with Text before the drawing leaves your machine.
Export
Send the sheet out as its own PDF, as a CAD drawing, or leave it to be carried into the PDF report as the report's diagram page.
Auto-build is a starting point derived from counts and topology rules, not a protection design. Nothing on the sheet is checked against a standard, a fault level or a grid code. Read every rating and every device before the drawing goes to anyone.
Where the diagram goes
Three routes out, covered on Exporting the diagram:
- The report's diagram page. The PDF report carries the diagram as one of its pages, on the same sheet you drew it on.
- A standalone PDF. The sheet on its own, for review or for a drawing register.
- A CAD drawing. The symbols written out as real drawing entities, for a drafting team to take further.
The rest of diagram mode
Symbol reference
Every symbol in the palette and what it represents
Building a diagram from the plant
Auto-build, the two chains it draws, and the topology rules behind them
Importing diagrams and custom symbols
Bringing in an existing drawing, and tracing your own symbols
Exporting the diagram
The report page, a standalone PDF, and the CAD file