Pile layout
Define a pile pattern on one reference table, stamp it onto every table in the plant, and export the coordinate report a setting-out team works from.
The pile layout feature produces a construction document: the position of every foundation pile in the plant, drawn and tabulated, in a form a setting-out team can work from. You define the pattern once, on a single table, and the application places it on every table in the plant and reports the total.
It is a construction output, not a design check. Nothing here validates the pile pattern against a structural design — the number of piles, where they sit along the table and how big they are all come from you, or from the structure supplier's drawing.
One pattern, every table
The editor works on one reference table. That is the whole idea, and it is what makes the feature quick: a plant repeats one table design across the whole site, so the pattern only has to be described once.
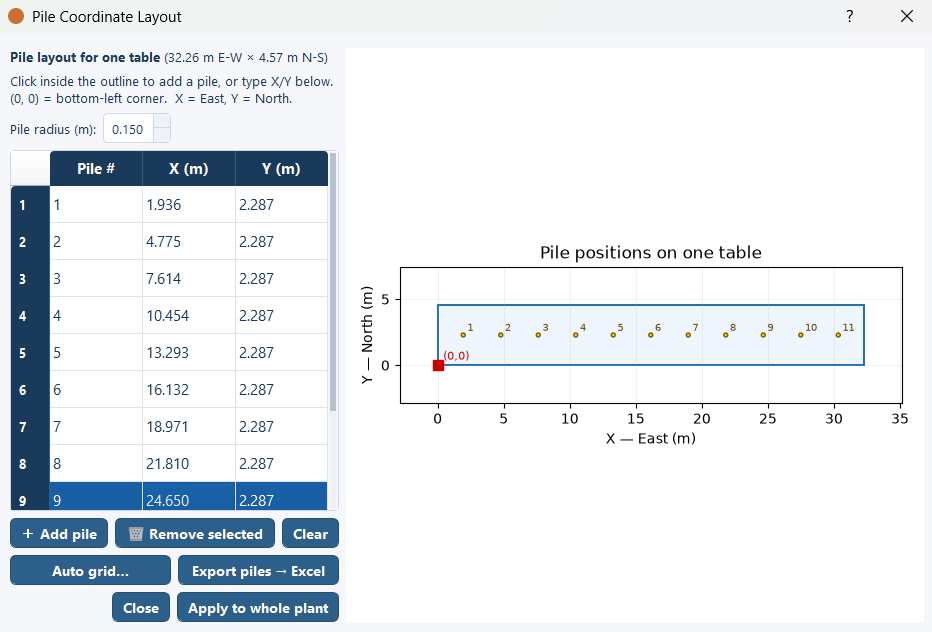
The coordinate frame
The reference table has its own local frame, independent of the site:
- The origin, (0, 0), is the table's bottom-left corner — its south-west corner on the ground.
- X runs east, across the table's width.
- Y runs north, up the table's height.
Both axes are in metres, and the table's width and height are the table's own dimensions, set by the module size, the module counts and the gaps in MMS-Table Configuration. See Table configuration. A coordinate outside the range 0 to the table width, or 0 to the table height, puts that pile off the table.
The frame is only as big as the table
The extent of the frame is the table itself, so it changes whenever the table changes. Modules per row and the east–west gaps set how far X can run; rows per table and the north–south gaps set how far Y can run. Orientation changes both: a portrait table puts each module's short side east–west and its long side north–south, and a landscape table reverses that.
The consequence is practical. A pattern entered against a portrait table does not transfer to a landscape one, and a pattern entered before you changed the modules per row no longer sits where you meant it to. If you change the table configuration, open the editor again and check the pattern against the new frame before exporting.
What a pile is
Each pile is drawn as a circle of the radius you give, centred on the (X, Y) you entered. The default radius is 0.15 m.
The radius is a drawing and setting-out figure — the pile as it appears in plan. The pile diameters for lightning arresters and street lights are separate fields in Structures & Shadow and are not part of this pattern. See Structures and shadow.
How the pattern reaches the rest of the plant
The pattern is stamped onto every table in the plant. Each table keeps its own position; the pattern is applied relative to that table's own south-west corner.
So a pile's position on the ground is:
the table's south-west corner, X metres east and Y metres north.
That relation is worth knowing because it lets you check the report by hand. Take any table, take its south-west corner, step east by the pattern's X and north by its Y, and that is the coordinate the report gives for that pile. All internal geometry is in metres, projected to the site's local UTM zone, so the report's coordinates and the pattern's offsets are in the same units and add directly.
Opening the editor
Generate a layout first
📍 Piles: OFF on the toolbar is disabled until a layout exists. There is nothing to stamp a pattern onto before that.
Click 📍 Piles: OFF
The first time you use it, the Pile Layout editor opens so you can define the pattern.
Place the piles on the reference table
Work on the single table the editor shows, entering each pile's X and Y and its radius. The drawing and the coordinate table are two views of the same pattern.
Reopen it whenever you need to
Later changes go through Edit-Pile ▸ Define Pile Layout… on the menu bar. The toolbar button then switches the overlay on and off.
Checking the pattern against the ground
The pile overlay stays visible even with the Plant Layout switch off. That combination — piles on, layout off — is the one to use when you are checking the pattern, because nothing is drawn except the piles themselves.
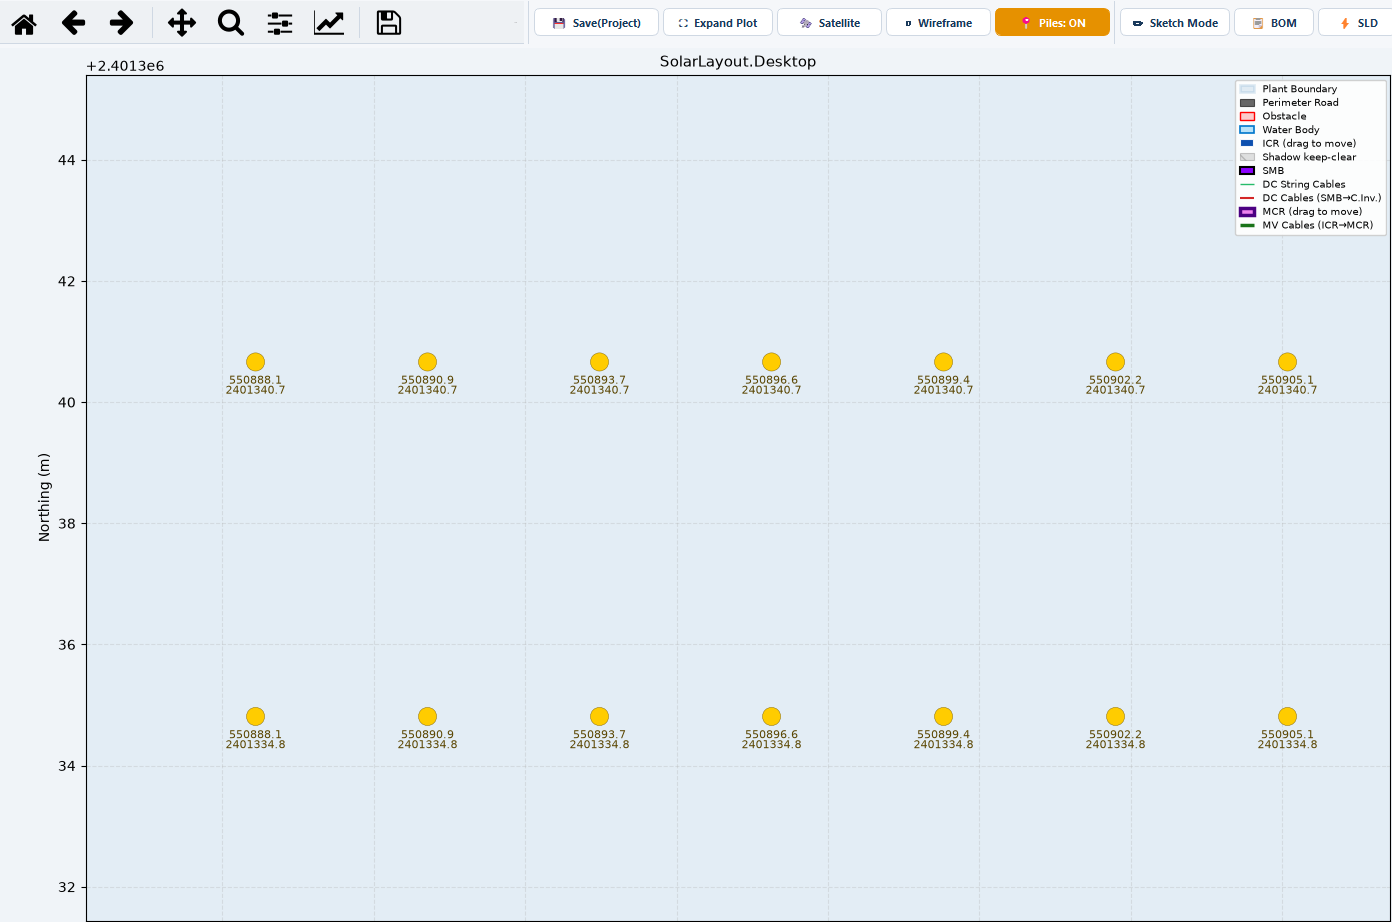
With the tables hidden you can see the pattern as a field of points and judge it the way the setting-out team does: whether the rows read cleanly, whether the spacing along the table is what the structure drawing says, whether anything lands somewhere impossible. The aerial photograph and the terrain contours have their own switches, so you can leave either behind the piles.
What the summary reports
The Piles column of the Layout & Energy Summary is the plant's total pile
count, computed as the number of tables multiplied by the number of piles in
the pattern.
Two things follow:
- Change the pattern and the total changes. Add a pile to the reference table and the column rises by one per table in the plant.
- Change the table count and the total changes. Anything that adds or removes tables — an obstruction, an arrester footprint, a hand edit in Sketch Mode — moves the pile total with it.
The full column list is in Summary columns.
Half tables receive the full pattern
The pattern is stamped onto every table in the plant without checking whether that table is a full one or a half unit, and the column counts every table at the full pattern size.
On a plant using half-table infill this makes the pile figure optimistic, and some stamped piles can fall outside a half unit's narrower footprint. Check the overlay over a run of half units before handing the count to a procurement or setting-out team.
If half units are a material share of the plant, treat the column as an upper bound and count them separately. Whether to use half-table infill at all is covered in Maximizing placement and half tables.
Exporting the pile report
Export PDF (with Piles) writes the pile drawing. It sits beside Export PDF (Layout + Summary), which is the ordinary report without the pile pages.
Both reports are A3 landscape. The difference that matters for this one is resolution: the first page of the pile export is drawn at 300 dpi, where the ordinary report's pages are drawn at 150. A pile drawing is printed large and zoomed into on site, and the ordinary resolution does not survive that.
If you are handing one document to a survey or setting-out team, this is the one. See PDF report for what the other pages of the report carry.
Limits
The editor holds one pattern at a time, and applies it to every table in the plant. A plant that mixes table types — a different module count, a different number of rows — needs one pass per type: define the pattern for the first type and export, then redefine it for the second and export again. There is no way to hold two patterns at once.
Beyond that:
- Nothing is checked against a structural design. Pile count, position and radius are inputs. The application draws and counts what you enter; it does not test whether the foundation works.
- Nothing is checked against the ground. The pattern is geometric, so it is applied identically on level and sloping ground. Where relief within a single table footprint matters, that is what Max height var / table in Topography is for — it governs which ground is used at all. See Topography.
- The pattern cannot vary by location. Every table gets the same pattern, so there is no way to treat the tables in one corner of the site differently. Export a pattern per table type, as above.
Where to go next
Annotations, measuring and layers
The drafting side of Sketch Mode — lines, shapes, text, measurements and dimensions, organised on layers and groups, plus the typed command line.
How yield is calculated
The full energy model — in-plane irradiance, performance ratio, specific yield, degradation, capacity factor — and where each result appears.