The PDF report
The multi-page A3 report — the two export buttons, what each page carries, and what you must do before exporting for a page to appear at all.
The PDF report is the document the rest of a project is run from: an engineering drawing of the plant, the numbers behind it, the single-line diagram, the materials list, and the energy estimate — in one file, every page the same size.
How many pages you get depends entirely on how much of the design you have completed. The report writes what exists. A diagram you have not built and an energy calculation you have not run are pages that are absent — with no warning and no placeholder.
The two export buttons
| Button | What it produces |
|---|---|
| Export PDF (Layout + Summary) | The standard report — the drawing, the summary, the diagram, the materials list and the energy pages |
| Export PDF (with Piles) | The pile report — the same report with the pile pattern drawn on the layout, and the drawing page at a higher resolution |
Both need a generated layout. Neither adds anything to the plant or changes it: exporting is a read of the current session, so you can export as often as you like while you work.
Every page is A3 landscape
The report is emitted at A3 landscape — 16.54 × 11.69 in — for every page, including the tables. That is a deliberate choice for a drawing set: one paper size across the whole document, so it prints and folds as a set rather than as a drawing with correspondence attached.
The file's own properties name it as a SolarLayout.Desktop report, so it is identifiable in a document management system without opening it.
The pages, in order
The report is always assembled in this order. A page that has nothing to write is skipped, and the pages after it move up — so page numbers shift depending on what you have done.
1. The engineering drawing
The layout itself, drawn to fill the sheet, inside a drawing border with a north arrow at the top right and a title block. Beside it sits a plant details table.
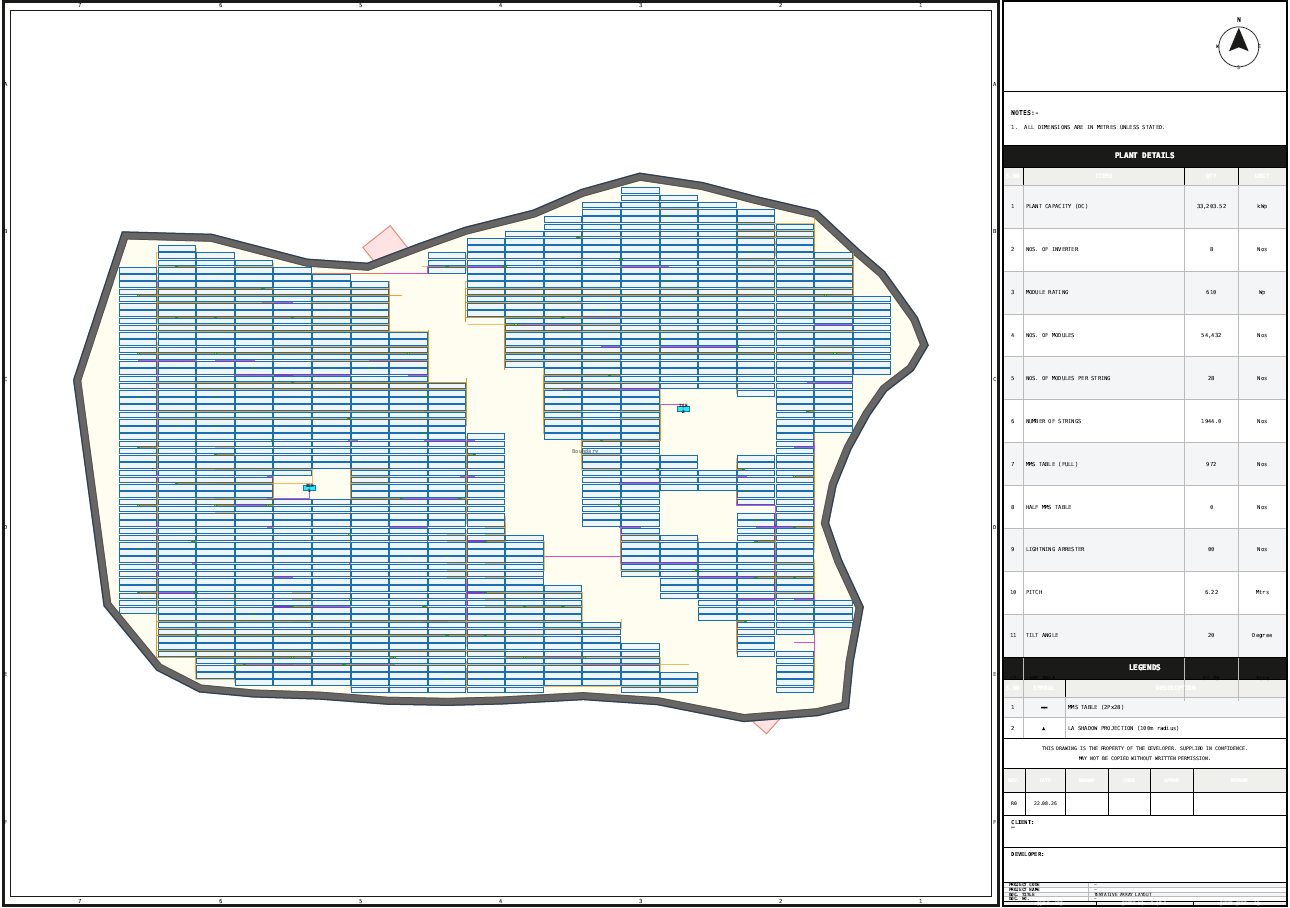
The plant details table is not static text. It carries editable form fields, so the PDF can be completed after it is exported — in a PDF reader, by whoever has the information, without coming back to the application and exporting the drawing again. That is what the fields are for: the details that identify a drawing are usually settled by somebody other than the person who ran the layout, and often after the drawing has been issued. Type into the fields in the reader and save the file.
2. The summary
Three blocks of numbers on one page: the layout summary, the design parameters that produced it, and the inverter and cable summary.
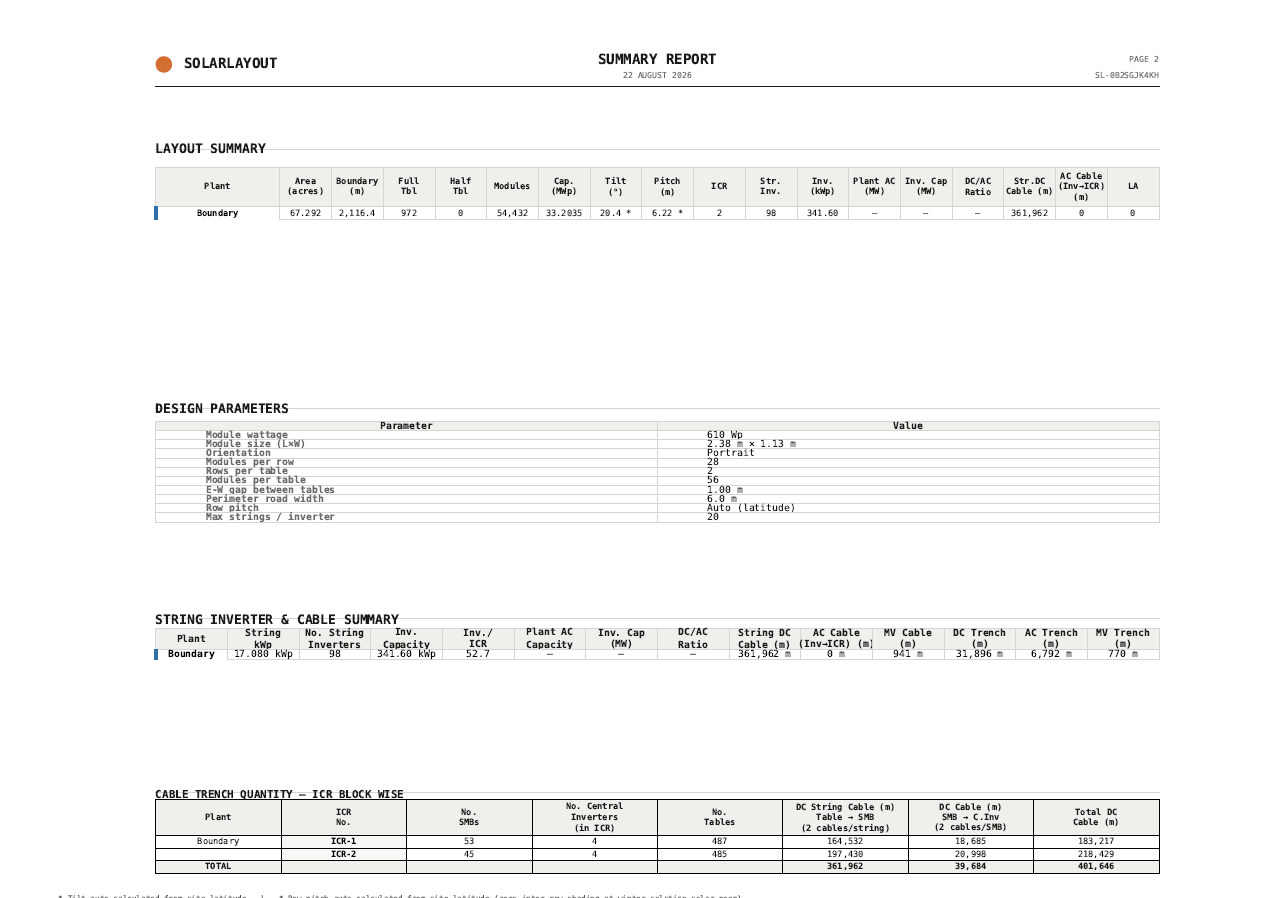
The inverter and cable summary includes the per-control-room cable breakdown — cable lengths attributed to each inverter control room rather than only totalled for the plant. That is the figure a cable schedule and a trenching estimate are built from, because it tells you where the length is, not only how much of it there is. See Cable routing.
The design parameters block is the reason this page matters even when the drawing is the deliverable: it records the tilt, pitch, spacing, equipment sizes and loss assumptions the drawing was produced under, so a drawing issued today can be reconciled with a design revisited months later.
3. The single-line diagram
Your diagram, on its sheet, exactly as you built it in diagram mode. See Single-line diagram.
On a large plant the diagram is emitted on a physically larger sheet — A3 to A1 to A0 — while the drawing itself keeps A3 proportions, so a dense diagram stays legible when printed rather than being crushed onto one A3 sheet.
If the diagram cannot be drawn, the page is skipped silently and the rest of the report is written normally. So a report with no diagram page is not a failed export — it means either that you have not built a diagram, or that the diagram itself has a problem. Check the diagram in diagram mode; do not re-run the export expecting a different result.
That behaviour is the right trade for a report you are about to circulate: a problem in one drawing never costs you the drawing, the summary, the materials list and the energy pages.
4. The materials list
The bill of materials, paginated across as many pages as it needs. A long list runs on to further pages; nothing is truncated to fit.
- What it shows
- One bill of materials page from the report, legible enough to read the columns.
- How to get there
- Open the bill of materials page of the same exported report.
What is written is the list as it currently stands, edits included — and, if you have overlapped a template into it, the template's rows. See Bill of materials.
5. The energy pages
Present only when an energy calculation has been run. No calculation, no energy pages — that is the only condition, and nothing else gates them.
- What it shows
- An energy page from a report where energy was calculated with monthly data available, so the monthly table and the multi-year forecast appear.
- How to get there
- Calculate energy with an hourly file or the automatic service before exporting, then open the energy pages.
You get either two pages or one, depending on the data behind the calculation:
| Data available | Pages | What they carry |
|---|---|---|
| Monthly data available | Two | First the inputs and the performance ratio breakdown; then the monthly table to IEC 61724-1 and the multi-year forecast |
| No monthly data | One | The inputs, the performance ratio breakdown and the results combined on a single page |
The monthly table reports the IEC 61724-1 quantities month by month — reference yield, final yield and the resulting performance ratio — and the multi-year forecast runs the degradation out across the plant lifetime you set. See How yield is calculated and Lifetime and P-values.
Which pages you will actually get
Read down this table before exporting a report you intend to issue. Four of the five sections are conditional on something you did earlier in the session, and the conditions are not reported anywhere at export time.
| Page | Written when | Absent when |
|---|---|---|
| Engineering drawing | Always, once a layout has been generated | — |
| Summary | Always, once a layout has been generated | — |
| Single-line diagram | You have built or automatically built a diagram | No diagram exists, or the diagram cannot be drawn |
| Materials list | The materials list has rows | — |
| Energy | An energy calculation has been run | No calculation has been run |
Nothing here depends on your licence, on an option you have to be granted, or on anything other than the state of the session in front of you. If a page is missing, the cause is on this table.
The cable figures on the summary page and the per-control-room breakdown exist only if Calculate Cables for PV Power Plant was ticked for the run that produced the layout. With cable calculation off, the page is still written and the cable entries read as not computed.
Set the view before you export
The drawing page is drawn from the view you are looking at rather than from a fixed template, with one exception covered below. The switches beside the plot therefore decide what the first page contains:
| Switch | Effect on the drawing page |
|---|---|
| Plant Layout | Whether the tables or tracker units are drawn at all |
| Legend | Whether the legend appears |
| AC Cables / DC Cables / MV Cables (ICR→MCR) | Whether each cable type is drawn |
| Contour / Terrain | Whether the elevation contours are drawn |
All three cable switches and the terrain switch are OFF by default, even on a run that computed cables and terrain. So the default export shows a clean layout — which is usually what a general arrangement drawing should show, and never what a cable drawing should show.
Decide what the drawing is for, set the switches to match, then export. The straightforward approach is to export more than once: a clean general arrangement with the cables off, and a cable drawing with them on.
The arrester switch is the exception
Lightning Arresters is the one switch the drawing page ignores. Whatever it is set to when you export, the report forces the arrester rectangles and their labels visible and forces the protection-radius circles hidden, then puts your on-screen state back as it was.
Two things follow, and both are surprises otherwise:
- Arresters always appear on the drawing page, on any run that placed them — including a run where you had the switch off and saw none on screen. The rectangles are their footprints, and they are on the drawing because a footprint is buildable information.
- The coverage circles never appear. The protection-radius circles are an on-screen review aid only. A drawing showing which ground each arrester covers is not something this report produces, so if a lightning-protection review needs that, it has to be done on screen. See Lightning arresters.
Placement, and what each switch is showing you, is covered on How placement works.
The pile report
Export PDF (with Piles) produces the same report with the pile pattern drawn on the layout — the pattern you defined on one reference table, stamped onto every table in the plant.
Its drawing page is rendered at 300 dpi rather than the standard report's 150 dpi. That doubling is there because a pile drawing is read at the scale of a single pile: a setting-out crew needs to resolve individual circles within a table, not the shape of the plant. Expect a larger file for the same plant.
Define the pattern before exporting — see Piles.
Before you export
Each of the steps below adds pages or content to the report. Doing them in this order means one export rather than four.
Generate the layout
Nothing exports without a placed plant. Turn cable calculation on for the run if you want cable lengths in the summary and the per-control-room breakdown. See Cable routing.
Calculate energy
Calculate Energy is what makes the energy pages exist. Use an hourly weather file or the automatic service so monthly data is available and you get the fuller two-page version. See Weather data.
Build the diagram
Use the automatic build and then edit it, or draw it yourself. Without a diagram there is no diagram page. See Automatic diagram build.
Check the materials list
Switch 📋 BOM on, rebuild it once against the finished plant, and correct what needs correcting — because whatever is in it is what prints. See Bill of materials.
Set the view, then export
Set the switches for the drawing you want, then click Export PDF (Layout + Summary) — and Export PDF (with Piles) as well if you have defined a pile pattern.
What the report does not do
- It does not stamp or certify anything. The plant details table is a set of blank fields for you to complete, not an approval record.
- It does not version itself. Two exports of the same session produce the same document, and nothing tracks revisions for you. Manage that in the file name and in the fields you fill in afterwards.
- It is not the CAD deliverable. The drawing page is a picture of the layout, not a layered drawing an engineering team can work in. For that, use the CAD drawing export.
Where to go next
Materials list templates
The four built-in reference materials lists, how to open one beside the computed list, and the action that replaces the computed list with it.
Google Earth export
The layout written as a Google Earth file — one folder per plant, the summary placemark, and how to check the design against real ground.