Weather data
The automatic irradiance service and its fallback, your own hourly file and what it must contain, and how horizontal irradiance becomes in-plane.
Every energy figure the application reports is downstream of one number: the annual in-plane irradiance at your site. There are two ways to supply it — an automatic fetch over the internet, or a full-year hourly file of your own — and the choice between them is the single largest decision in the yield estimate. It is a larger lever than any loss component you might argue about afterwards.
The two options are mutually exclusive, and both feed the same pair of irradiance fields further down the panel.
- What it shows
- The top of the Energy Yield group: the weather source divider, both options with the automatic one ticked, and the irradiance fields below with their source label.
- How to get there
- Nothing changed from defaults.
The two sources
| Option | What it gives you | What it needs |
|---|---|---|
| PVGIS API (auto-fetch on Calculate) | In-plane irradiance for your position, tilt and orientation, fetched when you calculate | An internet connection. No key, no account. |
| Hourly GHI file (CSV) | A full year of your own hourly data, and optionally its own in-plane column and its own temperatures | A file you supply |
PVGIS API (auto-fetch on Calculate) is the shipped default.
Two abbreviations appear throughout, on the option labels and on the fields. GHI is global horizontal irradiance — what a sensor lying flat on the ground measures. GTI is global tilted irradiance, also called in-plane or plane-of-array irradiance — what a sensor lying in the plane of the modules measures. The second is the one that produces energy; the first is what most weather records contain.
The automatic service
Selecting the automatic option means nothing is fetched until you click Calculate Energy. At that moment the application asks the service for the irradiance at your site latitude and longitude, at the array's tilt and orientation, and fills the irradiance fields with what comes back.
The service is the EU Joint Research Centre's PVGIS. It needs an internet connection and nothing else — there is no API key to obtain and no account to register.
What makes it the better of the two automatic paths is that it returns in-plane irradiance directly. The tilted-plane transposition has already been done, for your latitude, your tilt and your orientation, inside the service. Nothing is estimated locally.
The fallback
Coverage is not universal. When the service has no data for your site, the application falls back to NASA POWER, and the two are not equivalent:
| PVGIS | NASA POWER | |
|---|---|---|
| What it returns | In-plane irradiance, directly | Monthly horizontal irradiance climatology |
| How in-plane is obtained | Already in-plane | A simple isotropic tilt correction is applied to estimate it |
| Time resolution available | Hourly, when fetched hourly | Monthly averages |
The fallback is therefore the less precise of the two. A monthly climatology is an average of many years rather than a representative year, and an isotropic tilt correction is the crudest of the tilt models — it treats diffuse light as arriving equally from every part of the sky, so it does not capture the circumsolar brightening a better model does.
Neither service is silent about which one you got. The source is reported on screen with the irradiance figures, so you always know which of the two produced your number before you quote it.
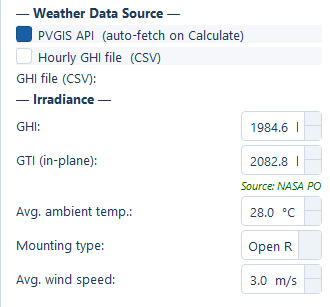
If neither service returns data, the irradiance fields stay at zero and the source reads as unavailable. That is a visible failure, not a silent fallback to a default irradiance — a zero irradiance produces a zero yield, and you will see it immediately.
Your own hourly file
Selecting Hourly GHI file (CSV) reveals a Browse… row and shows a format reminder straight away.
- What it shows
- The reminder with its full three-column table.
- How to get there
- Select the hourly file option. The reminder appears immediately. Capture the reminder in the panel — not a weather file opened in a spreadsheet.
The reminder asks for exactly three columns, in this order:
| Position | Column | Unit |
|---|---|---|
| 1 | An hourly timestamp | — |
| 2 | Global horizontal irradiance | W/m² |
| 3 | Ambient temperature | °C |
A full year is 8,760 rows — 365 days at hourly resolution. A header row is optional and detected automatically, so a file exported straight from a data provider usually needs no editing.
Note the unit on the irradiance column. The file carries irradiance in watts per square metre, one value per hour — not an hourly energy in Wh/m², and not a daily or monthly total. The two are numerically equal for hourly data, but they are not the same quantity, and the row interval this input expects is one hour.
What the application actually accepts
The reminder describes the strictest form of the file. The application is more tolerant than that, in two ways worth knowing before you reformat anything.
Column names are matched flexibly. The order in the reminder is a safe default, but a named header is recognised whatever position it sits in:
| Quantity | Accepted column names |
|---|---|
| Time | time, datetime, date, timestamp, time(utc), time(local), date/time |
| Horizontal irradiance | ghi, g(h), gh, global_horizontal, global horizontal irradiance, irradiance, solar irradiance, allsky_sfc_sw_dwn |
| In-plane irradiance | gti, g(i), gi, in-plane irradiance |
An in-plane column is used directly. The third group above is not in the reminder at all, and it is the most valuable of the three. If your file already carries in-plane irradiance — because you bought a dataset generated for your specific tilt and orientation, or because you have measured it on a plane-of-array pyranometer — that column is used as it stands. No transposition is performed, and none of the modelling assumptions in the next section apply to your numbers.
- What it shows
- The file row after a valid hourly file has been read, showing the summary line, and the source label below the irradiance fields.
- How to get there
- Select the hourly file option, then Browse… and pick a full-year file that includes a temperature column.
- Callouts to add
- Outline the summary line.
Why the temperature column earns its place
The third column is easy to dismiss as optional detail. It is not.
When a temperature column is present, the monthly average temperatures used by the model come from your data. When it is absent, they come from a sinusoidal seasonal model whose amplitude is scaled from the site's absolute latitude — a reasonable generic shape, but a generic one.
That matters because monthly performance ratio moves with module temperature, and module temperature is driven by ambient temperature. A monthly PR series built on measured ambient temperatures is defensible in a way that one built on a latitude-derived sine wave is not, and the monthly table is exactly the part of the output a technical reviewer reads line by line. See Temperature loss for the thermal model the temperatures feed.
How horizontal irradiance becomes in-plane
When the file carries only a horizontal column, the in-plane figure is derived in three steps.
Solar position
For each timestamp, the solar declination, the hour angle and the solar zenith angle are computed from the site latitude and the day of year. This fixes where the sun is in the sky for that hour.
Split the horizontal irradiance into beam and diffuse
A horizontal measurement is one number containing two physically different components: direct beam radiation from the sun's disc, and diffuse radiation from the rest of the sky. They transpose onto a tilted plane completely differently, so they must be separated first.
The split uses the Erbs (1982) correlation, which estimates the diffuse fraction from the clearness index — the ratio of the measured horizontal irradiance to the extraterrestrial irradiance on a horizontal plane at that moment. A low clearness index means an overcast hour, which is mostly diffuse; a high one means a clear hour, which is mostly beam.
Transpose onto the module plane
The two components are then projected onto the tilted plane with the Hay-Davies model:
GTI = Gb·Rb + Gd·(1+cos β)/2 + ρ·GHI·(1−cos β)/2| Term | What it is |
|---|---|
GTI | In-plane irradiance — the result |
Gb | The beam component on the horizontal plane |
Rb | The geometric ratio of beam irradiance on the tilted plane to beam irradiance on the horizontal plane |
Gd | The diffuse component on the horizontal plane |
β | The module tilt angle from horizontal |
ρ | The ground reflectance used inside the transposition — a fixed value of 0.20, not the Ground albedo (ρ) field in the panel |
GHI | The measured horizontal irradiance |
The three terms are, in order: beam projected geometrically onto the plane, sky diffuse seen by the fraction of the sky the tilted plane faces, and light reflected from the ground into the plane.
Note which ρ this is. The transposition holds its own fixed ground reflectance
of 0.20 and is never handed the panel's Ground albedo (ρ) field, so editing
that field does not move the in-plane figure. It changes the rear-side gain on a
bifacial plant and nothing else — see Bifacial gain.
Two assumptions the transposition makes
Both are recorded here because both are things a reviewer will ask about.
- Panels are assumed to face the equator — due south in the northern hemisphere, due north in the southern. There is no azimuth input to the transposition, so a deliberately off-axis array is not modelled.
- Timestamps are treated as local solar time. No time-zone offset or equation-of-time correction is applied to your file's timestamps. A file stamped in UTC for a site several time zones away will place the day's irradiance at the wrong solar hours, which shifts the shape of the day without changing the annual total.
Neither assumption applies when your file carries its own in-plane column, or when the automatic service returns in-plane irradiance directly.
The irradiance fields
Two fields hold the annual figures the calculation actually uses. Both are filled automatically — by the fetch, or from the file — and both remain editable, so you can type a figure from a source the application never saw.
| Field | Default | Range | What it does |
|---|---|---|---|
| GHI | 0.0, auto-filled | 0–3000 kWh/m²/yr | Annual global horizontal irradiance. Feeds the transposition, and the rear-side irradiance estimate on a bifacial plant. |
| GTI (in-plane) | 0.0, auto-filled | 0–3500 kWh/m²/yr | Annual in-plane irradiance. This is the figure multiplied by the performance ratio to give specific yield. |
GTI (in-plane) is the one that sets the yield. If you are entering a figure by hand from a purchased study, that is the field to enter it in — putting an in-plane figure into the horizontal field will not produce the yield you expect.
A source label accompanies the pair, naming where the current values came from. Read it before quoting any energy number. The Ground albedo (ρ) field sits in the same group but belongs to the rear-side model rather than to these two figures; the ambient temperature and wind fields belong to the thermal model on Temperature loss.
Which source to use
For a bankable estimate, use your own data. A purchased typical meteorological year for the site coordinates, or measured data from a ground station near the site, is the only input that supports a yield number under scrutiny. If that dataset carries an in-plane column, it removes the transposition from the discussion entirely; if it carries a temperature column, it removes the seasonal temperature model too.
For a first pass, use the automatic service. It is a single click, it needs nothing from you, and it is entirely adequate for comparing two layouts on the same site — where both estimates share the same irradiance and the comparison is unaffected by its absolute accuracy.
The charts and the time-series export need an hourly series. An annual total alone — whether typed in or from the monthly fallback — is not enough to build one. Load an hourly file, or fetch hourly data from the automatic service. See Charts and time series.
Where to go next
How yield is calculated
The full energy model — in-plane irradiance, performance ratio, specific yield, degradation, capacity factor — and where each result appears.
The loss breakdown
Every component of the performance ratio — inverter, cables, soiling, temperature, mismatch, shading, availability, transformer and other — with defaults and ranges.