Google Earth export
The layout written as a Google Earth file — one folder per plant, the summary placemark, and how to check the design against real ground.
The Google Earth export writes the whole plant as a .kmz file: boundaries,
exclusion zones, module tables, inverters, control rooms, arresters and cables,
organised into folders you can switch on and off. Opened in Google Earth, the
layout is drawn over aerial imagery of the actual site.
It exists for two jobs. The first is handing the design to somebody who does not have CAD — a landowner, a client's commercial team, a lender, a contractor walking the site on a laptop — and who needs no drawing conventions to read it. The second is your own check: the layout drawn over real ground is the fastest way to see whether the plant sits where you think it does.
When to use it
| Situation | Why this export |
|---|---|
| Sending the layout to a non-technical reader | Google Earth needs no CAD skill and no drawing conventions |
| Checking the plant against real ground | The imagery shows what is actually there, not what the boundary file claimed |
| Verifying the exclusions | A water body or a building drawn in the wrong place is obvious over imagery and invisible on a plain drawing |
| Site walking | The file can be taken to the site and compared with what is in front of you |
For a drawing an engineering team will work in, use the CAD drawing export instead. This file is for reading, not for drafting.
What the file contains
The structure follows the plant. One folder per boundary, named after the plant it holds, so a multi-plot site arrives as one folder per plot rather than as one flat pile of geometry. See Multi-plot sites.
Each plant folder holds:
| Contents | What it is |
|---|---|
| The boundary polygon | The plant boundary as it was read from your input file |
| The exclusion zones | The ground kept clear of modules |
| The panel tables | Every table or tracker unit that was placed |
| A summary placemark | The plant's headline figures, in a balloon |
Alongside the per-plant folders sits an Overall Summary folder, aggregating every boundary in the file. On a single-plot site it repeats the one plant; on a multi-plot site it is the figure you quote for the project as a whole.
The electrical equipment is written too: the inverters or string monitoring boxes, the inverter control rooms, the lightning arresters, and the cables. Cables only exist to be written if cable calculation was on for the run — see Cable routing.
Three things the file does not carry
The list above is the whole file. Three parts of the design that the plot and the CAD drawing export both carry are not written to the Google Earth file at all:
- Street lights. Neither the poles nor their shadows appear, so a reader cannot check the perimeter lighting from this file.
- Piles. The pile pattern is not written, however it is defined. Take the pile drawing from Export PDF (with Piles) instead — see Piles.
- Terrain contours. The elevation contours and the ground the slope limits excluded are absent, so a reader cannot see why an area of the site is empty.
This is worth saying to the recipient rather than leaving them to notice. Ground that was excluded on slope, or a corner kept clear for a lighting pole, simply reads as unused land here. When either of those has to be visible, send the CAD drawing export or the report drawing alongside.
The summary placemark
Each plant's summary placemark opens a balloon carrying four figures:
- Capacity, in MWp
- Area, in acres
- Row pitch
- Table count
- What it shows
- The balloon that opens when the summary placemark is clicked, showing its figures.
- How to get there
- In Google Earth, click the summary placemark.
Those four answer the questions a reader asks first, in the order they ask them, without needing the report. It is worth knowing they are there before you send somebody the file and a separate summary sheet — the file already carries the headline.
The same figures, with everything else, are in the summary table under the plot and on the report's summary page. See Summary columns.
Opening it
Export the file
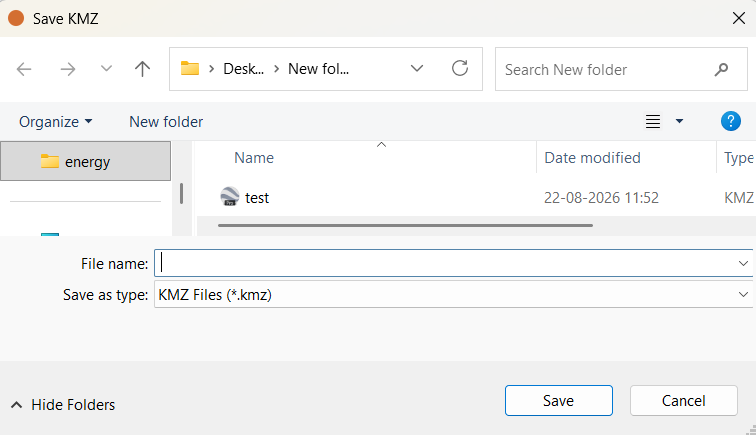
Click Export KMZ in the export block beside the plot, after a layout has been
generated. Choose the folder and the file name; the file type is fixed to .kmz.
Open it in Google Earth
Double-click the file, or use Google Earth's own open command. Google Earth flies to the plant and draws the layout over the imagery.
Expand the folder tree
The places panel lists the plant folders and the Overall Summary folder. Expand a plant to reach the boundary, the exclusions, the tables and the summary placemark.
- What it shows
- Google Earth with the exported file open, the Places tree expanded to show the per-plant folders and the summary folder, and the layout drawn over the imagery.
- How to get there
- Export the mapping file, then open it in Google Earth Pro and expand the tree. The frame is Google Earth, not the save window.
- Callouts to add
- Label the per-plant folder and the summary placemark.
Every folder and every item in it has a tick box, and that is what makes the file useful for checking rather than only for showing. Switch the tables off and the exclusions stay — so you can see the ground the layout kept clear against the imagery underneath it, with nothing drawn on top of it. Switch the boundary off and the tables alone show you how close the plant runs to the fence.
Google Earth's own view and measurement tools work on the file as they do on any other, so the layout can be examined from any angle without going back to the application.
Checking the design against real ground
This is the part worth doing on every project, because it catches the class of error nothing else catches. Your boundary file is a claim about the site; the imagery is a record of it. Compare them.
Four checks, in the order they are worth making:
- Is the plant where you expect it? A boundary file with a coordinate problem produces a perfectly correct layout in the wrong place. Over imagery this takes one second to see. It is the single most valuable check on this page.
- Do the exclusions match what is on the ground? A pond that has moved, a building that has been demolished, a canal that was never drawn, a track worn across the site — the imagery shows them and your input file may not. Every difference is either a table that should not have been placed or ground you gave away for nothing.
- Is the boundary the parcel you actually control? Field boundaries and access tracks are usually visible. A plant boundary that crosses one is worth resolving before the layout is issued.
- Is access plausible? Roads, gates and the route heavy equipment must take are on the imagery and not in the layout.
Anything that fails these checks is a problem in the input, not in the layout. Fix the boundary file and generate again — see Boundary file requirements.
The satellite view inside the application does the same job while you work, so you do not have to export to make the comparison. The 🛰 Satellite button draws aerial imagery behind the layout, aligned to the file's coordinates. Both it and Google Earth need an internet connection.
Limits
- It is a mapping file, not a drawing. There are no layers in the CAD sense, no line weights, no annotation set and no title block. Dimensions cannot be taken off it to build from.
- Imagery has a date and a position error. Google Earth's photography was taken on some particular day and is registered to the ground to within a tolerance. Treat a small apparent offset between your boundary and a feature on the imagery as a question to investigate, not as proof either is wrong.
- A CAD or image boundary needs coordinates to land correctly. A drawing or an image carries no geographic position of its own, so unless you supplied a site latitude and longitude when loading it, there is nothing to place the layout against on the imagery. See CAD boundaries.
Where to go next
The PDF report
The multi-page A3 report — the two export buttons, what each page carries, and what you must do before exporting for a page to appear at all.
CAD drawing export
The layered drawing export — every layer and what it carries, why coordinates are in metres, and which layers are conditional on your settings.