Lifetime, degradation and P-values
First-year and annual degradation, the plant lifetime, combined uncertainty, and how the exceedance probability columns are derived.
Everything on this page turns a single first-year energy figure into the numbers a project is actually financed against: output in year 30, and output at a probability a lender will accept. Two degradation inputs set the decline, one lifetime input sets how far the forecast runs, and one uncertainty figure plus three exceedance probabilities set the confidence band.
None of it changes the layout. These are all post-processing on the energy result, so a change here needs the energy calculation run again and nothing more.
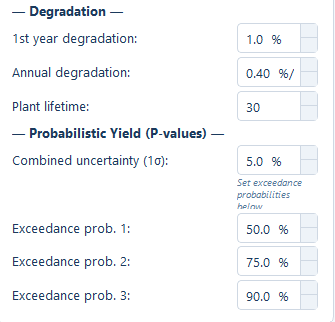
Degradation
| Field | Default | Range | What it does |
|---|---|---|---|
| 1st year degradation | 1.0 % | 0–10 % | A one-off reduction applied to the first year's output |
| Annual degradation | 0.4 %/yr | 0–5 %/yr | The compounding annual decline applied from year two onward |
| Plant lifetime | 30 years | 1–50 years | How many years the multi-year forecast runs for |
What the two figures represent
They describe two physically different things, which is why they are two fields and not one.
1st year degradation is the initial step down that a module takes in its first weeks and months of operation and then does not repeat — chiefly light-induced degradation, LID, the drop that occurs when a cell is first exposed to sunlight. A datasheet quotes this separately from the long-term rate for the same reason. It is applied once.
Annual degradation is the steady long-term decline that follows: encapsulant ageing, cell and interconnect wear, slow optical losses. It compounds, so it is applied to the previous year's figure rather than to the original one. A module warranty normally states this as a maximum annual rate, and the warranted rate is the defensible input.
The relations
Year 1 energy       = capacity_kWp × specific yield          (before LID)

Year 1 (actual)     = Year 1 energy × (1 − first_year_deg%)

Year n (n ≥ 2) = Year 1 (actual) × (1 − annual_deg%)^(n−1)| Term | What it is |
|---|---|
capacity_kWp | The plant's installed DC capacity in kWp — placed module count multiplied by module wattage |
specific yield | Annual energy per kWp installed, in kWh/kWp, computed as the in-plane annual irradiation multiplied by the performance ratio |
Year 1 energy | First-year output before the first-year step is taken off |
first_year_deg% | 1st year degradation, as a fraction: 1.0 % is 0.01 |
Year 1 (actual) | The first-year output actually reported — the figure the exceedance probabilities and the capacity factor are both built on |
annual_deg% | Annual degradation, as a fraction: 0.4 %/yr is 0.004 |
n | The year number, counting from 1 |
n − 1 | The exponent: year 2 has had one year of annual decline, year 30 has had 29 |
The exponent is the part that gets misread. Year 2 is Year 1 (actual) reduced
once, not twice — the first-year step and the first annual step are not both
applied to year two.
The defaults, worked through
On the shipped defaults — 1.0 % first year, 0.4 % annually — the multipliers on
Year 1 energy are:
Year 1  (actual) = 0.99
Year 20          = 0.99 × 0.996^19 = 0.99 × 0.9267 = 0.9174
Year 30          = 0.99 × 0.996^29 = 0.99 × 0.8903 = 0.8813
So a plant on the defaults is modelled at about 91.7 % of its pre-degradation first-year output in year 20, and about 88.1 % in year 30. Check those two multipliers against the warranty you have been given: a module warranted to hold 87 % at year 30 is consistent with these inputs, and one warranted to hold 80 % means the inputs are optimistic against the product being bought.
Plant lifetime
Plant lifetime sets how many years the multi-year forecast runs for, and nothing else. It ships at 30 years and accepts 1 to 50.
It has no effect on the first-year figure, on the capacity factor, or on any exceedance probability — those are all year-one quantities. What it does control is the length of the year-by-year table carried into the report's energy pages, and therefore the lifetime energy total. Match it to the term the project is being modelled over: the tariff term, the debt tenor, or the module warranty period, whichever the report is answering.
The summary header says 25yr whatever the lifetime is
The lifetime total reaches the summary table in a column headed 25yrP50(MWh),
and that header is fixed text. Unlike the three probability headers, which are
generated from the fields behind them, this one does not follow Plant
lifetime. The value under it is the sum of every year from 1 to Plant
lifetime, scaled to the first exceedance probability — so on the shipped
lifetime of 30 years, the column headed "25yr" holds a 30-year total.
Two things follow. Read the column as the lifetime total at the first exceedance probability, not as a 25-year figure — it is only a 25-year figure when the lifetime is actually set to 25. And when the number leaves the application, state the lifetime beside it, because the header will otherwise misreport it to whoever receives the table.
Probabilistic yield
A single energy figure is a central estimate, and a lender does not finance a central estimate. Probabilistic yield restates the same result as the output the plant will beat with a stated probability.
Exceedance probability
An exceedance probability — the P in P50, P75, P90 — is the probability that the actual annual energy comes out at or above the stated figure.
- P50 is the median: half of years land above it, half below.
- P90 is the figure the plant exceeds in 90 % of years. It is a lower number than P50, and it is lower precisely because it is more likely to be beaten.
- The higher the P number, the more conservative and the smaller the energy figure. P99 is a small number you are almost certain to exceed; P10 is a large one you will usually fall short of.
The single most common error in reading these figures is treating a higher P as a better plant. It is the same plant, described with more confidence.
Combined uncertainty
| Field | Default | Range | What it does |
|---|---|---|---|
| Combined uncertainty (1σ) | 5.0 % | 0.1–30.0 % | The one-standard-deviation spread of annual energy about the median, as a percentage of the median |
One sigma, σ, is the width of the distribution: on a normal distribution about
68 % of years fall within one sigma of the median. It is entered as a percentage
and used as a fraction — 5.0 % is 0.05 in the relations below.
It is a combined figure, which conventionally bundles together everything that makes one year differ from the long-run expectation: year-to-year variation in the solar resource itself, the uncertainty in the irradiance dataset used, transposition and yield model uncertainty, and uncertainty in the loss and degradation assumptions. The application takes it as one number and does not decompose it, so what it covers is what you decide it covers — and that decision belongs in the report alongside the figure.
The uncertainty figure does more to move a P90 than most engineering decisions on the page. At 5 % the P90 sits about 6.4 % below the P50; at 10 % it sits about 12.8 % below. Do not leave it at the default without deciding it is right for the resource data behind the run.
The two relations
P75 = P50 × (1 − 0.674 × σ)

P90 = P50 × (1 − 1.282 × σ)| Term | What it is |
|---|---|
P50 | The median annual energy — the first-year figure, undiscounted, since half of years exceed the median by definition |
σ | Combined uncertainty (1σ) as a fraction |
0.674 | The standard normal deviate for 75 % exceedance |
1.282 | The standard normal deviate for 90 % exceedance |
The multipliers are not tuning constants. They are the standard normal deviates — the number of standard deviations below the median at which the chosen fraction of the distribution lies above. Look up the standard normal distribution: 75 % of the area sits above −0.674σ, and 90 % of it sits above −1.282σ. The relations are the standard normal quantile applied to the median, which is why the same two numbers appear in every yield assessment you will be shown.
On the shipped σ of 5.0 %:
P75 = P50 × (1 − 0.674 × 0.05) = P50 × 0.9663
P90 = P50 × (1 − 1.282 × 0.05) = P50 × 0.9359
The P50 column takes no multiplier, because the deviate at 50 % exceedance is zero.
The three exceedance fields
| Field | Default | Range |
|---|---|---|
| Exceedance prob. 1 | 50.0 % | 1.0–99.9 % |
| Exceedance prob. 2 | 75.0 % | 1.0–99.9 % |
| Exceedance prob. 3 | 90.0 % | 1.0–99.9 % |
All three are yours to set. There is no fixed P50/P75/P90 triple in the application — 50, 75 and 90 are the shipped values, and each field accepts anything from 1.0 to 99.9.
The summary column headers are built from these values, so they rename themselves when you change them. Set the third field to 95 and the third column reports at 95 % exceedance under a heading that says so. Nothing else in the summary announces the change.
Because the headings are generated from the fields, a reader of your report must check the column heading rather than assume the third column is a P90. A screenshot, a pasted table or a summary passed on second-hand is only interpretable together with its heading. Say in the report body which exceedance probabilities the columns carry.
The columns sit at the right-hand end of the summary table, alongside the capacity factor and the lifetime energy total — see Summary columns.
Capacity factor
CUF = Year 1 (actual) / (capacity_kWp × 8760) × 100 %The capacity utilisation factor, CUF, is first-year output as a percentage of what the plant would generate running flat out at its full DC capacity for every one of the 8 760 hours in a year. It is a normalised figure, so it is what makes two plants of different sizes, or on different sites, comparable at a glance — and it is the figure tenders and regulators most often ask for.
Two things to hold on to when quoting it:
- It is computed after the first-year degradation step, from
Year 1 (actual), so it is a year-one figure. It declines over the plant's life in the same proportion as the energy does. - It is referenced to DC capacity here. A capacity factor quoted elsewhere against AC capacity is a different, larger number. State which base you are using.
Which figure to quote where
| Use | Figure |
|---|---|
| Base-case generation, internal comparison of two designs, tender responses asking for expected output | The median column — the P50 first-year energy |
| Debt sizing, a lender's base case, any downside case | The conservative column — the highest exceedance probability you have set, conventionally P90 |
| Comparing this plant against another site or another size | The capacity factor |
| Tariff or debt modelling over the project term | The year-by-year forecast to the plant lifetime, in the report's energy pages |
Quote the exceedance probability with the number every time, and quote the uncertainty that produced it. A P90 without its σ is not a checkable figure — the same plant yields a different P90 at 5 % and at 10 % uncertainty, and the reader has no way to tell which they have been handed. See The PDF report for where these figures land in the document you issue.
Where to go next
How yield is calculated
The first-year figure everything on this page is built from
Loss breakdown
The performance ratio behind the specific yield
Summary columns
Every column in the summary table, including the generated headings
Energy charts and time-series export
Hourly and monthly views of the same result
Row-to-row shading
The computed row-to-row shading loss, the geometry behind it, the Shadow View cross-section, and what the model does not cover.
Energy charts and time-series export
The daily and monthly energy charts, which data source is behind them, and exporting a full-year generation series at your chosen interval.