PDF report walkthrough
What's in the SolarLayout PDF report, page by page — your bid-pack-ready deliverable.
The PDF report is your bid-pack-ready deliverable. It captures the layout drawing, the design parameters, and (when energy yield was calculated) the per-plant production forecast — in one printable document. Most users send it directly to the bid committee or to the customer.
Exporting the PDF
Open the Download tab
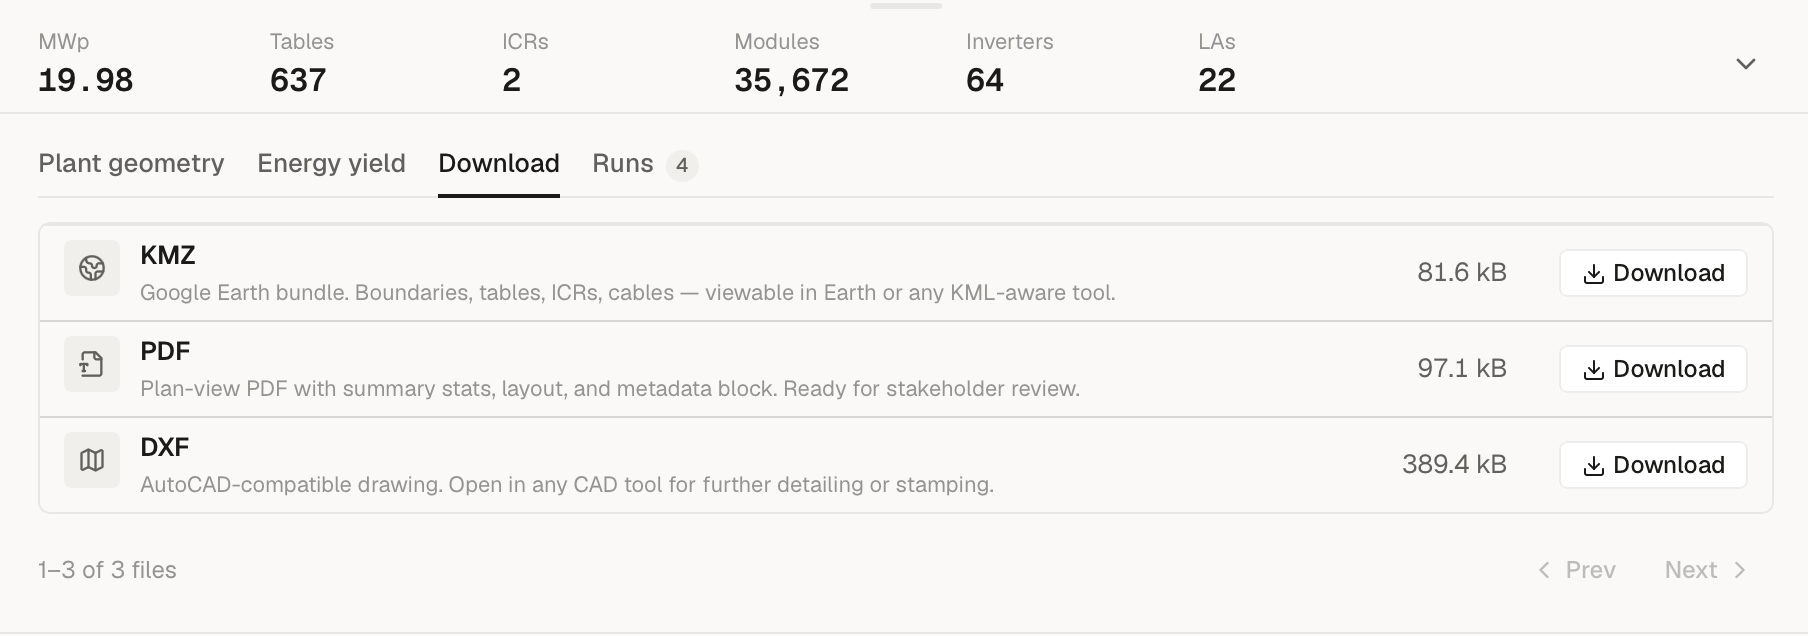
Open a completed run, then expand the bottom panel below the canvas and switch to the Download tab. The KMZ, PDF, and DXF rows each show a file size and a Download button.
Download the file
Click Download on the PDF row and your browser saves
<project>-<run>.pdf. Rename it afterwards if you need a different
naming convention for your bid pack.
Wait a few seconds
The PDF is rendered asynchronously by the exporter just after the run finishes, alongside the KMZ and DXF artefacts. The Download tab may briefly show "Preparing your downloads… this can take a moment after the run finishes" before the PDF row becomes downloadable; once it resolves, the download is a single fetch.
Share
Email it, drop it in Slack, or attach it to your bid submission system.
What's in the report
The PDF is 2 to 4 pages depending on what you generated, plus one extra A3 page when cable routing ran (a dedicated cable-routing sheet inserted right after Page 1):
| Pages | When you get this | Sheet size |
|---|---|---|
| 2 pages | Layout only — no energy yield calculated | P1 = A1, P2 = A3 |
| 3 pages | Layout + energy yield (PVGIS API, no hourly weather CSV) | P1 = A1, P2-P3 = A3 |
| 4 pages | Layout + energy yield + monthly breakdown (hourly weather CSV loaded) | P1 = A1, P2-P4 = A3 |
When cable routing ran, add +1 page to each count for the cable-routing sheet (so a layout-only run with cables is 3 pages; the full report with cables is 5).
Page 1 is always A1 (33.11 × 23.39 in) so the layout drawing prints at engineering scale; the remaining pages are A3 landscape.
Page 1 — Plant layout (A1)
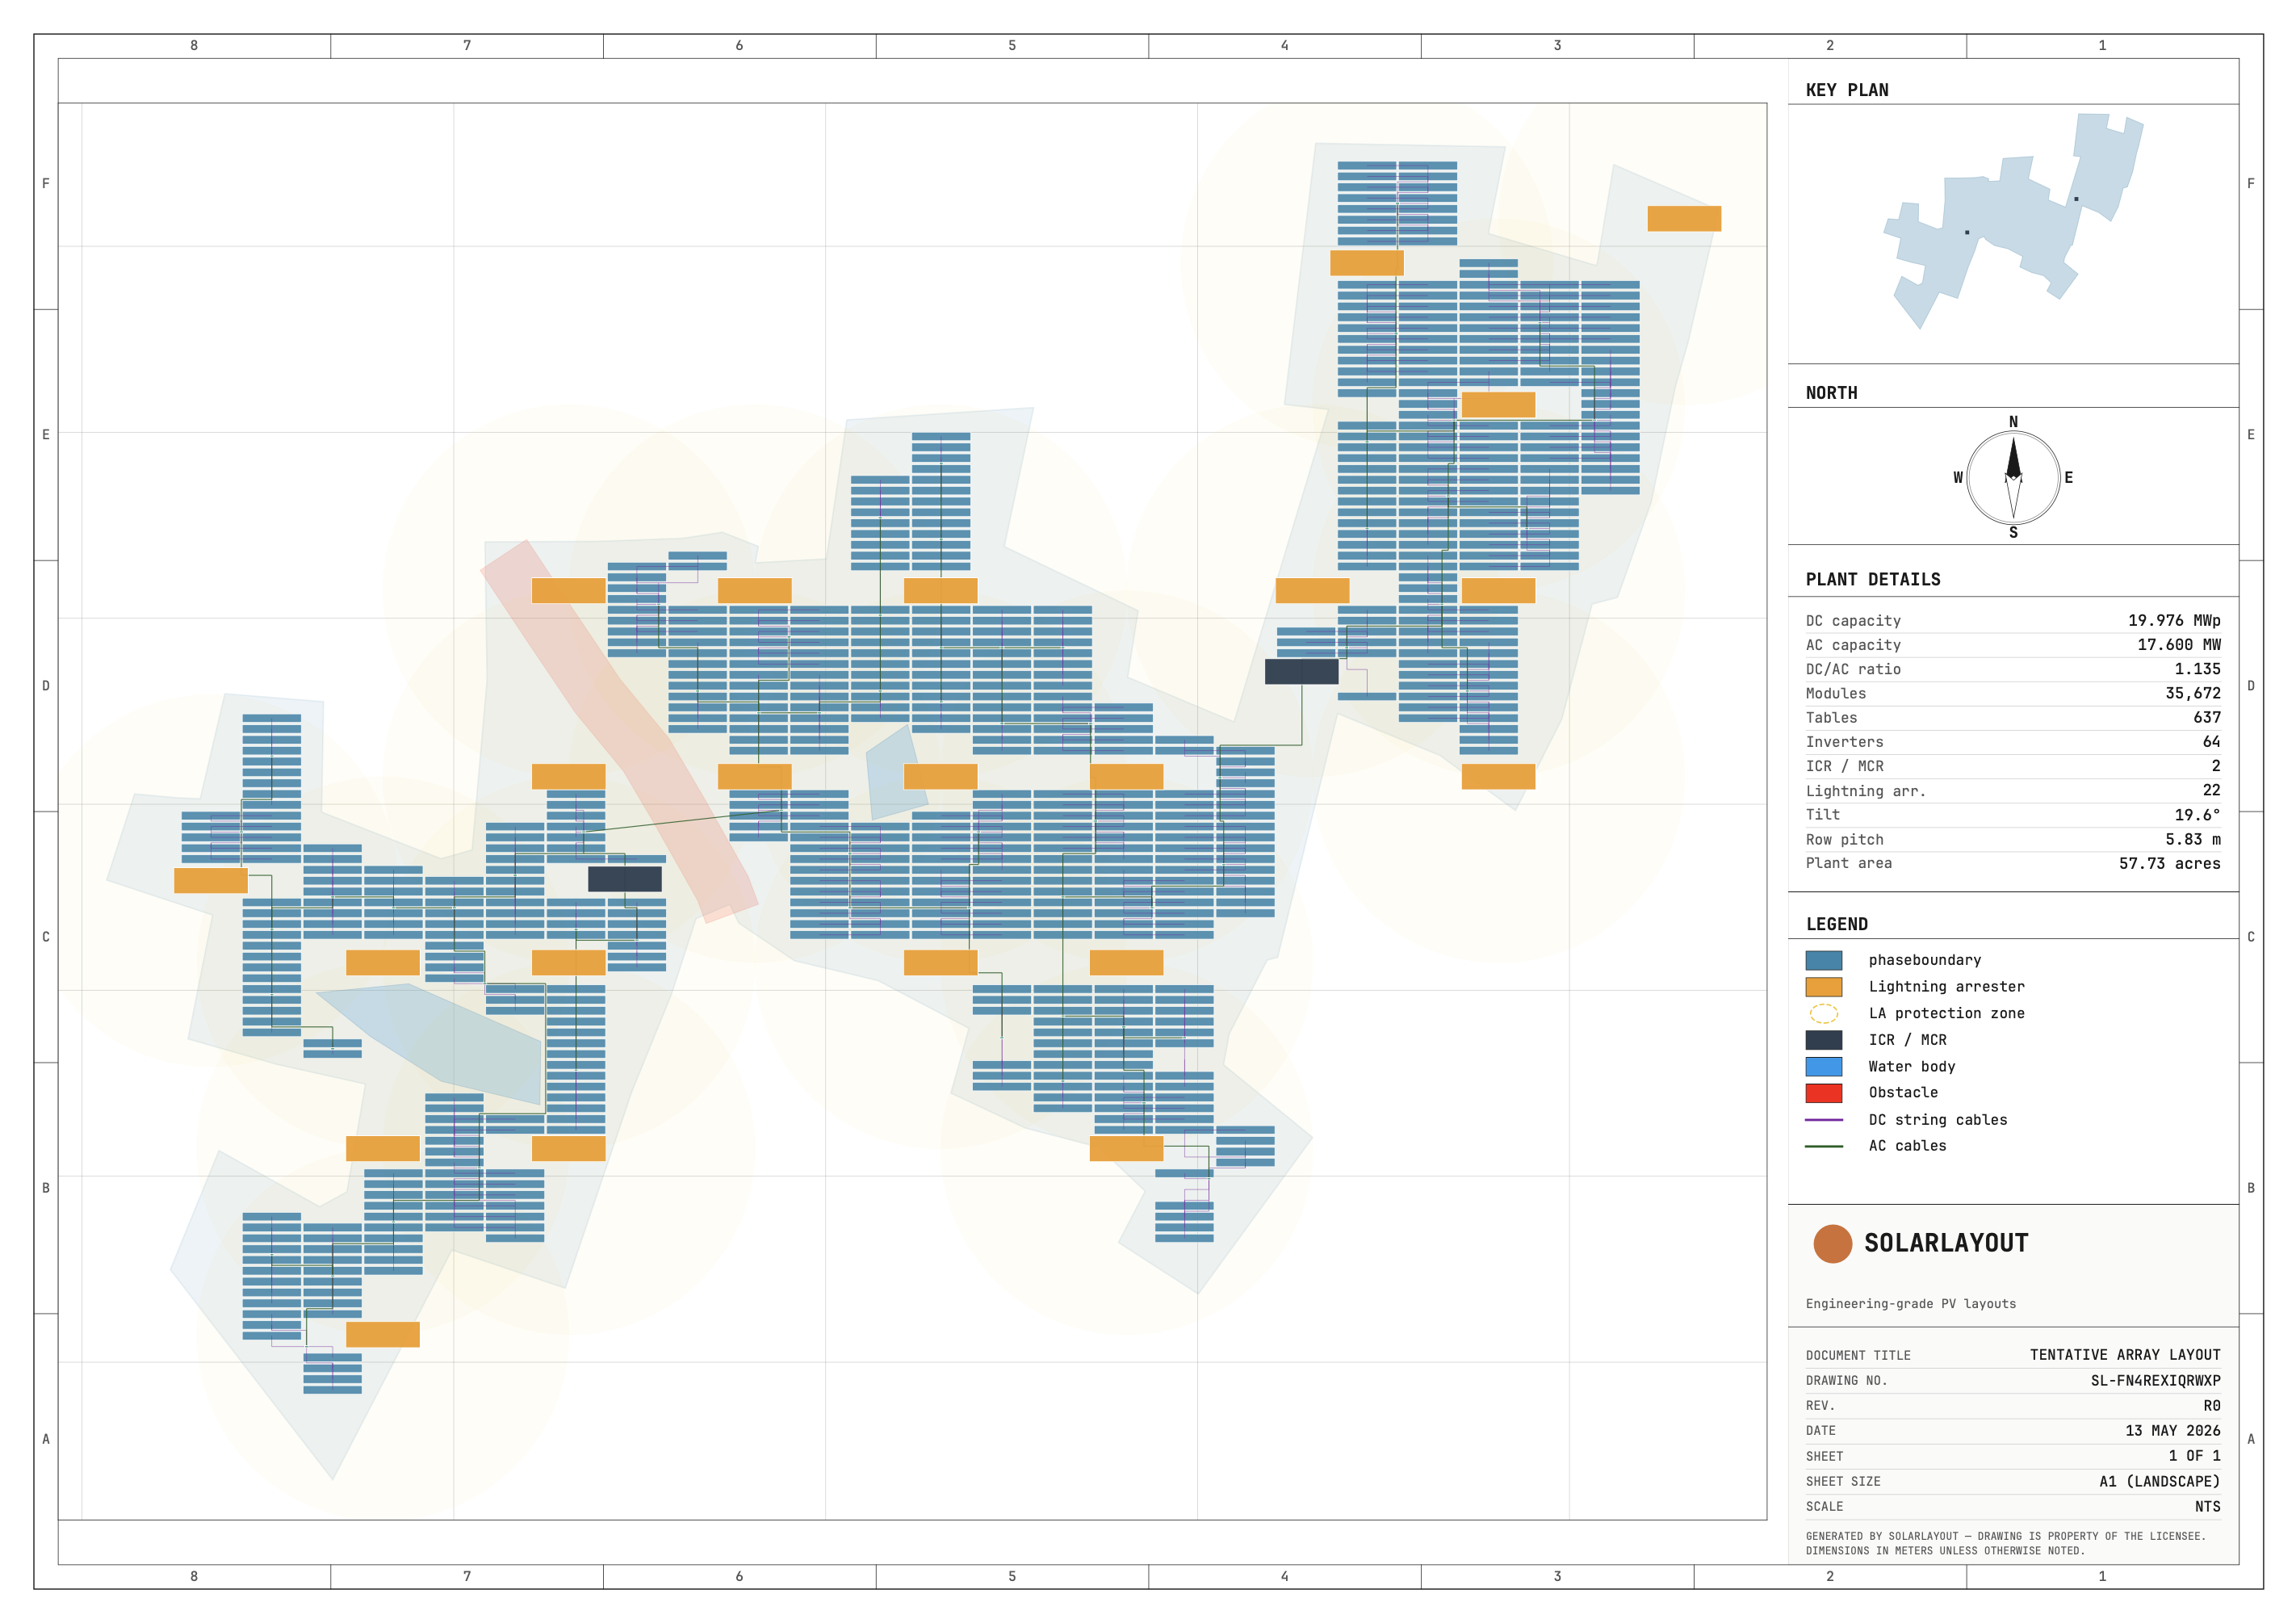
The to-scale layout drawing with title block, suitable for plotting on an A1 printer. Includes:
- The plant layout drawing itself — boundaries, panel tables, ICR buildings, string inverters / SMBs, lightning arresters, and exclusion zones. (Cable routes are no longer drawn here — when cable routing ran they get their own A3 cable-routing sheet, described below.)
- A small key plan inset showing where each plant sits on the site.
- North arrow.
- PLANT DETAILS panel: plant totals (summed across plants) — DC and AC capacity, DC/AC ratio, module count, table (or tracker) count, inverters / SMBs, ICRs, lightning arresters, tilt (or max angle), row pitch, and plant area. (GCR lives on Page 2 under Design parameters.)
- LEGEND panel: colour key for the drawing.
- Title block: the SOLARLAYOUT wordmark, a drawing number, document title ("TENTATIVE ARRAY LAYOUT"), sheet ("1 OF 1") and sheet size ("A1 (LANDSCAPE)").
Cable-routing sheet (A3, only when cable routing ran)
Title: CABLE ROUTING.
When cable routing ran, an extra A3 sheet is inserted right after Page 1. It shows the DC string cables and AC cables overlaid on the plant boundaries, with a CABLE LEGEND keying the cable colours. This is the page that used to be folded into the Page 1 drawing; it now stands on its own so the array layout and the cabling read separately. Runs without cable routing skip this sheet entirely.
Page 2 — Layout summary (A3)
Title: LAYOUT SUMMARY REPORT.
Two stacked sections:
- PLANT LAYOUT SUMMARY — per-plant rows with area, table count, module count, capacity, pitch, and (when cable routing ran) cable totals.
- DESIGN PARAMETERS — the inputs that drove this layout plus the measured result: design type, module orientation, tilt, row pitch rule, table dimensions, module spec (wattage + size), max strings per inverter, and the GCR achieved (the GCR measured from placement, not an input target).
This is the page a bid reviewer reads first.
Page 3 — Energy yield (A3, only when energy was calculated)
Title: ENERGY YIELD REPORT.
Top half is split two-column:
- PERFORMANCE RATIO BREAKDOWN — line-by-line PR components per IEC 61724-1.
- IRRADIANCE & DEGRADATION INPUTS — module and inverter spec, inverter Pnom, μ_Pmpp, NOCT, average ambient temperature, module type (with bifacial rows when applicable), annual GHI, in-plane GTI, irradiance source, weather source, first-year degradation, annual degradation, and plant lifetime. (Combined uncertainty appears in the page footer, not this panel.)
Bottom: PER-PLANT ENERGY SUMMARY with year-1 yield, specific yield, CUF, and lifetime production for each plant.
When you load a custom hourly weather CSV, this page is Page 3 of 4 and Page 4 adds the monthly + 25-year tables. When you use the PVGIS API directly, the same content compresses to a single Page 3 of 3 that also embeds the 25-year split.
Page 4 — Monthly + 25-year forecast (A3, only with hourly weather)
Title: ENERGY YIELD — MONTHLY + 25-YEAR FORECAST.
- MONTHLY ENERGY BREAKDOWN — IEC 61724-1 — YEAR 1 — 12 rows of per-month production with the IEC PR adjusted for that month's ambient temperature.
- <N>-YEAR GENERATION FORECAST — P-VALUES AT σ = <x>% — year- by-year production with P50 / P75 / P90 columns. Lifetime defaults to 25 years; configurable in Energy parameters.
This page only renders when the run used a custom hourly weather CSV (see PVGIS vs custom CSV) — that's the path that produces hour-by-hour data we can roll up to monthly.
The footer on the energy yield page reads "Generated by SOLARLAYOUT · PR per IEC 61724-1 · P-values: P50 = median; P75 / P90 = probability of exceedance at σ = <x>%", where <x> is the combined uncertainty you set in Energy parameters.
What's NOT in the PDF
- Bill of materials by part number — module/inverter counts are in the summary, but the PDF doesn't generate a procurement BoM.
- Cable cross-sections — cable totals are in the summary when cable routing ran; cross-sections aren't sized yet.
- Site-specific civil details — pile schedules, foundation drawings, civil clearances. Use DXF for the engineering hand-off.
When to use the PDF
The PDF is the right export when:
- You're submitting a bid to SECI, a state DISCOM, or an IPP.
- You're showing a client what their site can produce.
- An LTA or lender wants a read-only summary they can mark up.
- You want a single artefact that captures both the drawing and the yield calc.
For everything else — Google Earth review, CAD work, hour-level yield modelling — use one of the other exports:
- KMZ export for Google Earth.
- DXF export for AutoCAD-compatible engineering.
- 15-minute CSV for time-series yield analysis (only available when you ran with a custom hourly weather CSV).