How layout generation works
What happens between clicking Generate and seeing your finished layout.
When you click Generate layout, SolarLayout designs your plant in the cloud and draws the finished result on the canvas. Most layouts finish in 2–10 minutes.
What you'll see
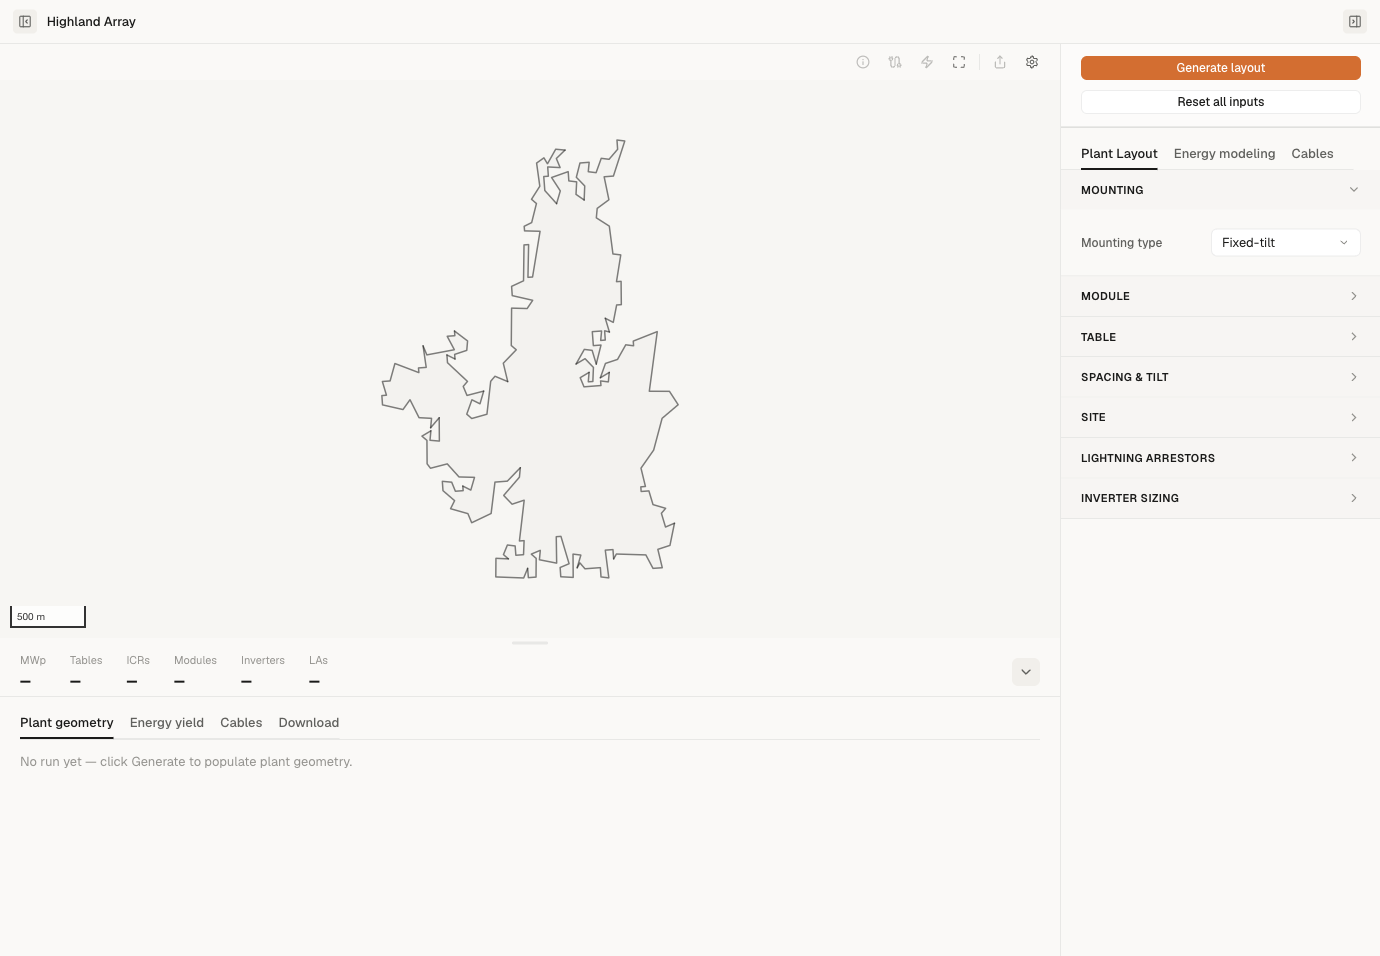
Click Generate layout
The button lives at the top of the Inspector panel (the input panel on the right side of the project), above the tab strip — so it stays in place whichever tab you're on. Once you click it, a status bar appears across the top of the canvas showing the run in progress.
Plots are designed in parallel
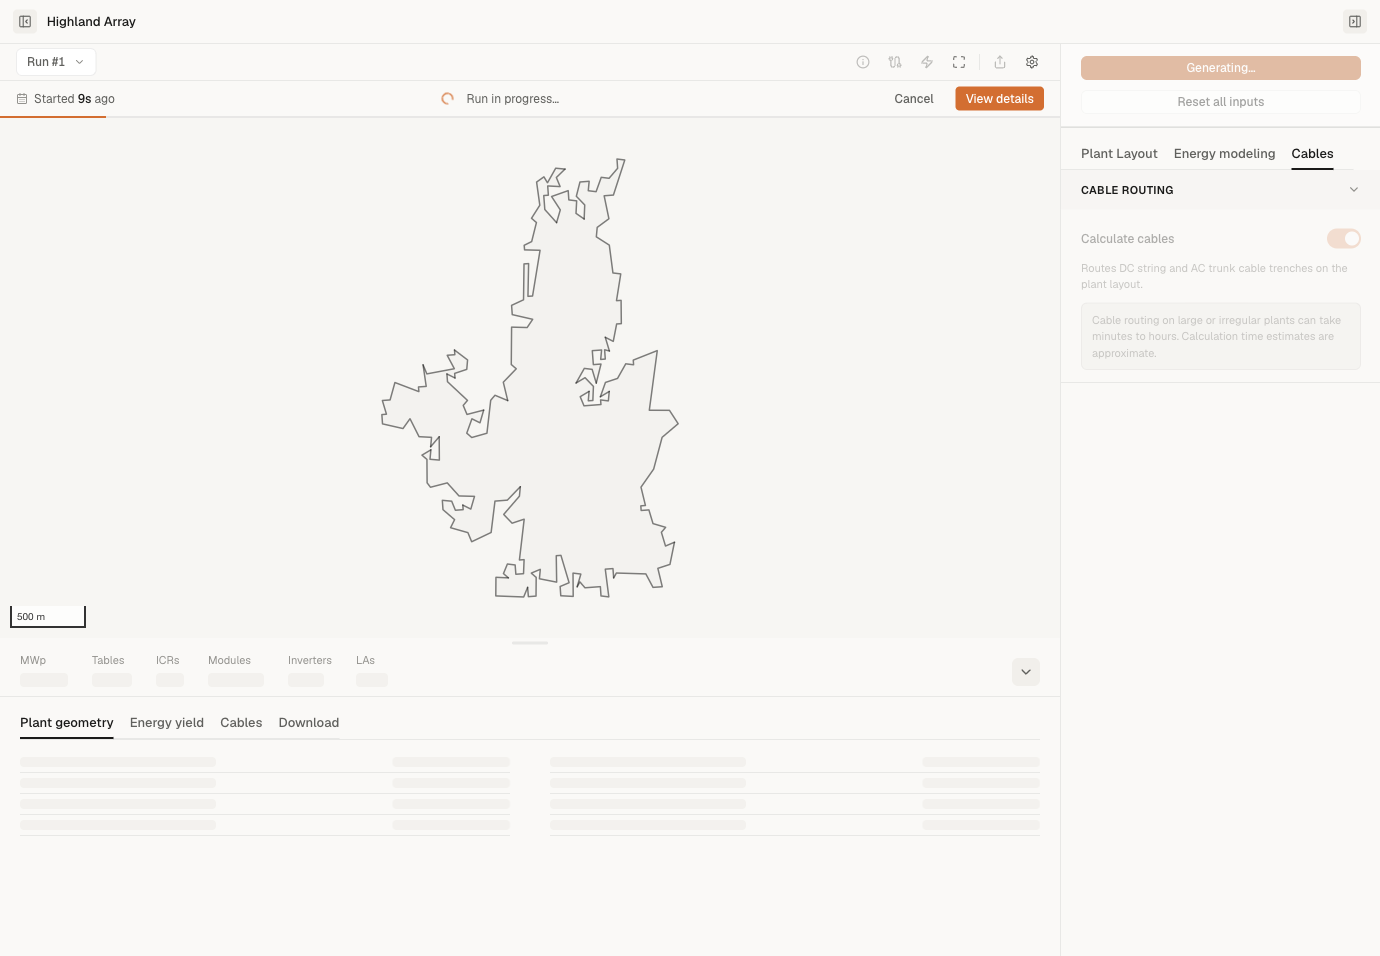
If your KMZ has multiple plot boundaries, each plot is designed at the same time on a separate cloud worker. While the run is in flight, the status bar across the top of the canvas shows the overall progress — Run in progress…, how long ago it started, and a progress bar — along with a Cancel button and a View details option. If the run finishes with a problem — some plots failed, or you cancelled it — an expandable plot-by-plot summary (one line per plot, marked queued / running / done / failed) appears in the Inspector after the run. A fully successful run shows no Inspector summary; the canvas status bar and View details are the completion surfaces.
For most projects this finishes in 2–10 minutes total. A single plot under 100 acres usually finishes in under a minute.
Your layout appears on the canvas
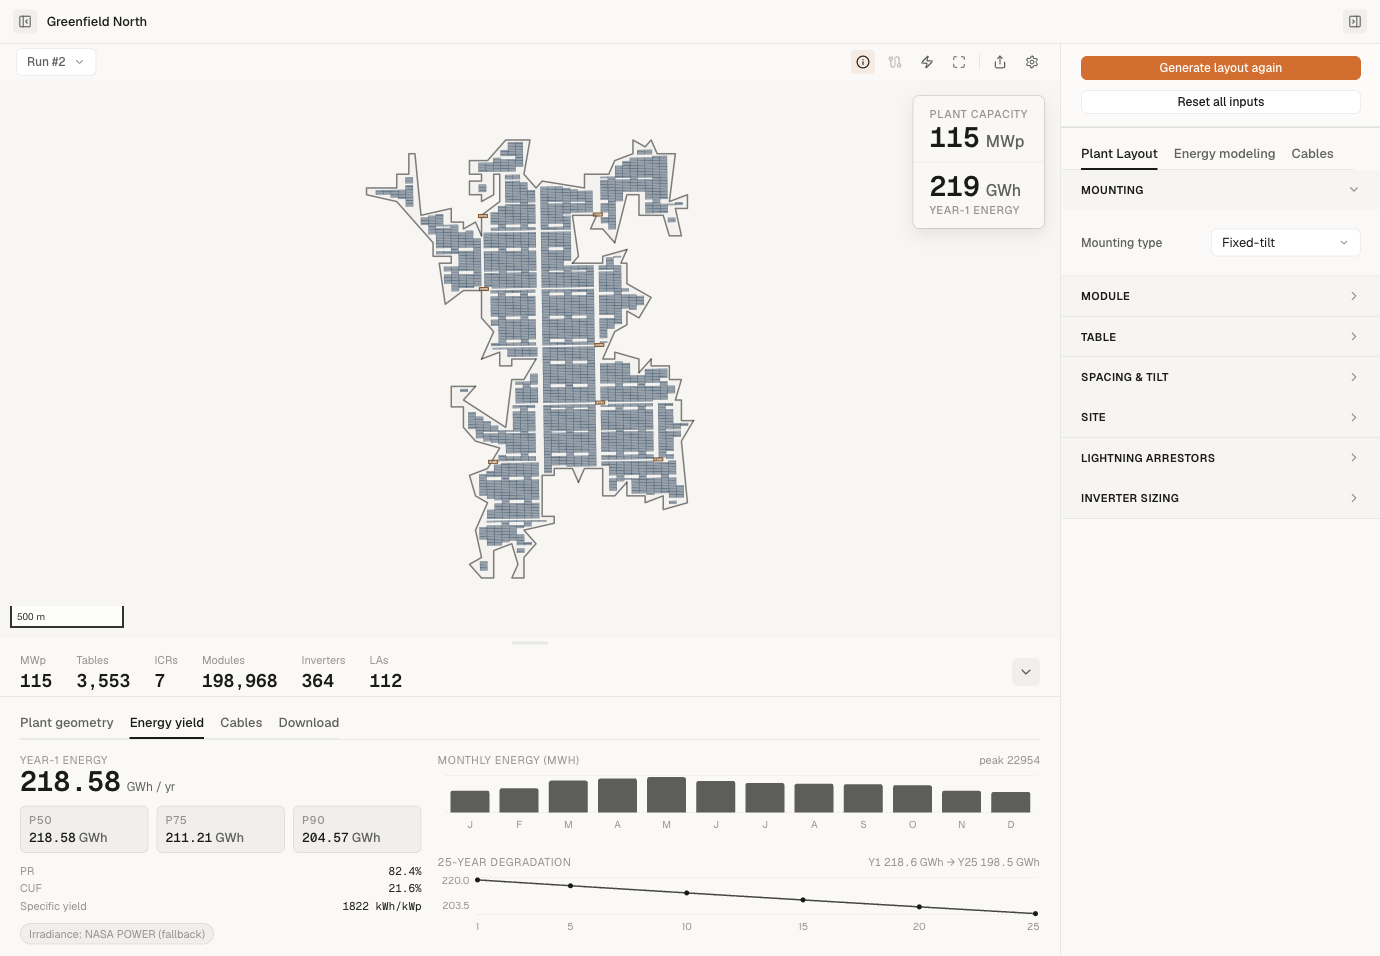
When all plots finish, the full layout appears on the canvas:
- Module tables — long thin rectangles, one row per table.
- Inverter Control Rooms (ICRs) — numbered squares, sized at approximately 18 MWp each.
- String inverters (string-inverter mode) — small rectangles placed near the tables they serve.
- DC and AC cables — lines connecting tables to inverters to ICRs. Only drawn if you enabled Calculate cables before generating, and your plan includes cable routing.
- Lightning arresters — placed at code-required intervals.
Energy yield (annual energy at three configurable exceedance values, P50 / P75 / P90 by default, and the 25-year degradation curve) appears in the Energy yield tab of the panel at the bottom of the canvas. Exports (PDF, CSV, and the map files) become available in the Download tab of that same bottom panel.
How long it takes
A rough guide for a single plot:
| Plot size | Typical time |
|---|---|
| Small (< 50 acres) | 30–90 seconds |
| Medium (50–500 acres) | 1–4 minutes |
| Large (500+ acres) | 4–10 minutes |
Plots are designed in parallel, so a 4-plot project usually takes about as long as its biggest individual plot — not 4× longer.
After every plot finishes, the per-plot outputs are merged into the project layout. While SolarLayout fetches that result and draws it on the canvas, a small Loading layout… chip sits in the centre of the canvas (a few seconds) so the empty map doesn't read as a stall.
If a plot fails
If one plot can't be designed, the rest of the project still completes and the canvas shows everything that succeeded. After the run, the expandable plot-by-plot summary in the Inspector marks that plot as failed.
To re-try a failed plot, click Generate layout again in the Inspector — this re-runs the whole project. (Per-plot re-run isn't available yet.)
See Cancelling a layout for how to stop a generation in progress.
What gets placed by default
SolarLayout places:
- Module tables sized per your module spec and table configuration. Row pitch is auto-derived from your latitude and tilt so the front edge of one row doesn't shade the back edge of the next at winter solstice, unless you override Row pitch in the Inspector.
- Inverter Control Rooms (ICRs) sized at approximately 18 MWp per ICR.
- String inverters or central inverters depending on the Design mode you picked in the Inspector.
- Lightning arresters at code-required intervals.
- DC and AC cables — only when Calculate cables is enabled (Pro plan only) before you click Generate. Otherwise no cables are drawn and the PDF report omits the cable BoM.
You can adjust tilt, row pitch, table gaps, inverter sizing and a few other parameters in the Inspector → Plant Layout tab before generating. See Cable routing for the cable-routing toggle.