The dashboard
The six panels the Dashboard tab draws after a run, its header strip, the 7-day scroll and the Maximize view.
The 📈 Dashboard tab draws a single chart: a header strip of headline figures above six panels, covering generation, the battery, DFR performance and the cash flow the run produced.
The header strip
A navy bar above the panels reports the run's sizing on the left — Solar, Wind and BESS — and two headline results on the right — IRR and Contracted Capacity.
The six panels
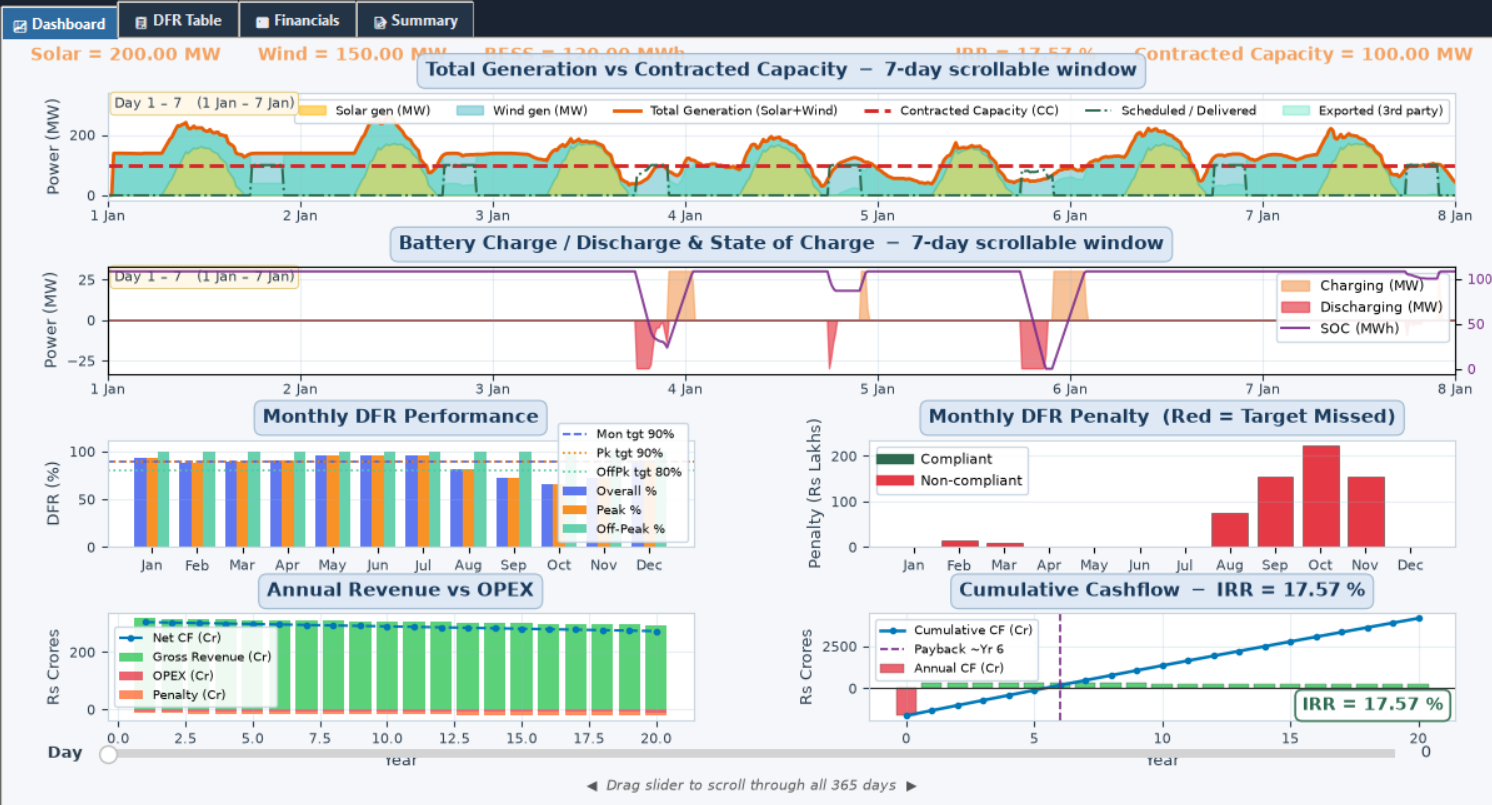
- Total Generation vs Contracted Capacity ─ 7-day scrollable window — a stacked solar/wind generation fill, a total-generation line against the Contracted Capacity line, a Scheduled/Delivered line, and an exported-surplus fill.
- Battery Charge / Discharge & State of Charge ─ 7-day scrollable window — charge, discharge and grid-charge fills on the left axis, state of charge (SOC, in MWh) on a twin right axis. Any day with grid charging is shaded purple on both this panel and the one above it.
- Monthly DFR Performance — grouped Overall, Peak and Off-Peak DFR percentage bars, one group per month, against their target lines.
- Monthly DFR Penalty (Red = Target Missed) — that month's penalty in Rs Lakhs, as a bar: green when Peak, Off-Peak and Overall all passed that month, red otherwise.
- Annual Revenue vs OPEX — Gross Revenue, OPEX and Penalty bars, plus a net cash-flow line, one point per project year.
- Cumulative Cashflow ─ IRR = … — the "…" is that run's own IRR figure, filled into the title. The panel draws annual and cumulative cashflow bars and a line, a payback-year marker, and an IRR badge.
The IRR badge on panel 6 is coloured green at 15% or above and red below it — a fixed benchmark, not the Project Target IRR field on the 📊 OPEX tab. The two only agree when that field is left at its own default.
The 7-day scroll
Panels 1 and 2 default to a 7-day window rather than the full year. A slider labelled Day, beneath them, scrolls both panels together across all 365 days, with an instruction beneath it reminding you to drag it.
Maximize
⛶ Maximize, next to the chart's toolbar, opens the same six panels in an enlarged window of their own. Press Esc, or close that window, to bring the chart back into the tab.